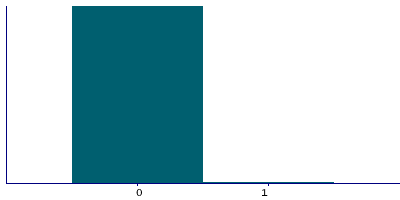
Data
215,439 items of data are available, covering 171,101 participants.
Some values have special meanings defined by Data-Coding
100291.
Defined-instances run from 0 to 3, labelled using Instancing
2.
Units of measurement are glasses.
| Maximum | 75 |
| Decile 9 | 0 |
| Decile 8 | 0 |
| Decile 7 | 0 |
| Decile 6 | 0 |
| Median | 0 |
| Decile 4 | 0 |
| Decile 3 | 0 |
| Decile 2 | 0 |
| Decile 1 | 0 |
| Minimum | 0 |
|

|
- There are 25 distinct values.
- Mean = 0.0317938
- Std.dev = 0.464347
- 1446 items above graph maximum of 1
- 172 items have value -3 (Prefer not to answer)
- 351 items have value -1 (Do not know)
|
4 Instances
Instance 0 : Initial assessment visit (2006-2010) at which participants were recruited and consent given
115,978 participants, 115,978 items
| Maximum | 75 |
| Decile 9 | 0 |
| Decile 8 | 0 |
| Decile 7 | 0 |
| Decile 6 | 0 |
| Median | 0 |
| Decile 4 | 0 |
| Decile 3 | 0 |
| Decile 2 | 0 |
| Decile 1 | 0 |
| Minimum | 0 |
|

|
- There are 22 distinct values.
- Mean = 0.0385281
- Std.dev = 0.512804
- 965 items above graph maximum of 1
- 148 items have value -3 (Prefer not to answer)
- 278 items have value -1 (Do not know)
|
Instance 1 : First repeat assessment visit (2012-13)
14,494 participants, 14,494 items
| Maximum | 12 |
| Decile 9 | 0 |
| Decile 8 | 0 |
| Decile 7 | 0 |
| Decile 6 | 0 |
| Median | 0 |
| Decile 4 | 0 |
| Decile 3 | 0 |
| Decile 2 | 0 |
| Decile 1 | 0 |
| Minimum | 0 |
|

|
- There are 11 distinct values.
- Mean = 0.0214794
- Std.dev = 0.312981
- 64 items above graph maximum of 1
- 4 items have value -3 (Prefer not to answer)
- 11 items have value -1 (Do not know)
|
Instance 2 : Imaging visit (2014+)
70,511 participants, 70,511 items
| Maximum | 42 |
| Decile 9 | 0 |
| Decile 8 | 0 |
| Decile 7 | 0 |
| Decile 6 | 0 |
| Median | 0 |
| Decile 4 | 0 |
| Decile 3 | 0 |
| Decile 2 | 0 |
| Decile 1 | 0 |
| Minimum | 0 |
|

|
- There are 16 distinct values.
- Mean = 0.0237216
- Std.dev = 0.407953
- 336 items above graph maximum of 1
- 18 items have value -3 (Prefer not to answer)
- 51 items have value -1 (Do not know)
|
Instance 3 : First repeat imaging visit (2019+)
14,456 participants, 14,456 items
| Maximum | 25 |
| Decile 9 | 0 |
| Decile 8 | 0 |
| Decile 7 | 0 |
| Decile 6 | 0 |
| Median | 0 |
| Decile 4 | 0 |
| Decile 3 | 0 |
| Decile 2 | 0 |
| Decile 1 | 0 |
| Minimum | 0 |
|
|
- There are 14 distinct values.
- Mean = 0.0276258
- Std.dev = 0.4403
- 81 items above graph maximum of 1
- 2 items have value -3 (Prefer not to answer)
- 11 items have value -1 (Do not know)
|
Notes
ACE touchscreen question "In an average WEEK, how many glasses of other alcoholic drinks (such as alcopops) would you drink?"
The following checks were performed:
- If answer < 0 then rejected
Field 5364 was collected from participants who indicated they drink alcohol more often than once or twice a week, as defined by their answers to Field 1558
Coding 100291 defines 2 special values:
- -1 represents "Do not know"
- -3 represents "Prefer not to answer"


