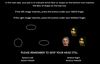
Data
70,319 items of data are available, covering 66,458 participants.
Defined-instances run from 2 to 3, labelled using Instancing
2.
Units of measurement are Z.
| Maximum | 8.78 |
| Decile 9 | 4.293 |
| Decile 8 | 3.792 |
| Decile 7 | 3.453 |
| Decile 6 | 3.177 |
| Median | 2.926 |
| Decile 4 | 2.682 |
| Decile 3 | 2.4255 |
| Decile 2 | 2.14 |
| Decile 1 | 1.752 |
| Minimum | -0.8026 |
|
|
- Mean = 2.98371
- Std.dev = 1.01386
- 1 item below graph minimum of -0.789
- 68 items above graph maximum of 6.834
|
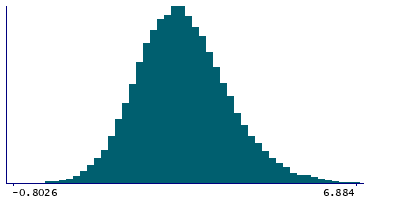
2 Instances
Instance 2 : Imaging visit (2014+)
66,035 participants, 66,035 items
| Maximum | 8.78 |
| Decile 9 | 4.2815 |
| Decile 8 | 3.781 |
| Decile 7 | 3.4415 |
| Decile 6 | 3.168 |
| Median | 2.916 |
| Decile 4 | 2.673 |
| Decile 3 | 2.417 |
| Decile 2 | 2.132 |
| Decile 1 | 1.7465 |
| Minimum | -0.8026 |
|
|
- Mean = 2.97455
- Std.dev = 1.0122
- 1 item below graph minimum of -0.7885
- 69 items above graph maximum of 6.8165
|
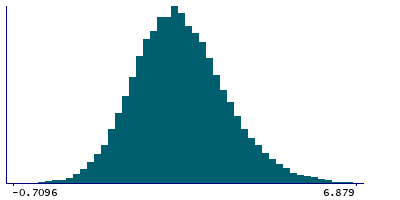
Instance 3 : First repeat imaging visit (2019+)
4,284 participants, 4,284 items
| Maximum | 7.723 |
| Decile 9 | 4.4795 |
| Decile 8 | 3.9635 |
| Decile 7 | 3.6185 |
| Decile 6 | 3.3335 |
| Median | 3.077 |
| Decile 4 | 2.824 |
| Decile 3 | 2.566 |
| Decile 2 | 2.2545 |
| Decile 1 | 1.858 |
| Minimum | 0.09106 |
|
|
- Mean = 3.12478
- Std.dev = 1.02885
- 3 items above graph maximum of 7.101
|