Data
68,033 items of data are available, covering 64,317 participants.
Defined-instances run from 2 to 3, labelled using Instancing
2.
Units of measurement are Z.
| Maximum | 8.84154 |
| Decile 9 | 3.96136 |
| Decile 8 | 3.54241 |
| Decile 7 | 3.25797 |
| Decile 6 | 3.02683 |
| Median | 2.82054 |
| Decile 4 | 2.61496 |
| Decile 3 | 2.40513 |
| Decile 2 | 2.16592 |
| Decile 1 | 1.83992 |
| Minimum | -0.536636 |
|
|
- Mean = 2.8694
- Std.dev = 0.845409
- 2 items below graph minimum of -0.281531
- 81 items above graph maximum of 6.08281
|
2 Instances
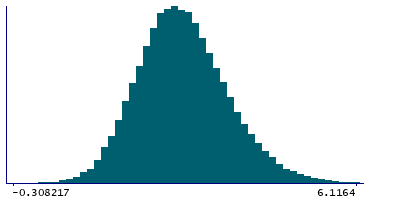
Instance 2 : Imaging visit (2014+)
63,839 participants, 63,839 items
| Maximum | 8.84154 |
| Decile 9 | 3.95392 |
| Decile 8 | 3.53455 |
| Decile 7 | 3.25085 |
| Decile 6 | 3.02075 |
| Median | 2.81459 |
| Decile 4 | 2.61012 |
| Decile 3 | 2.40043 |
| Decile 2 | 2.16188 |
| Decile 1 | 1.83593 |
| Minimum | -0.512723 |
|

|
- Mean = 2.8638
- Std.dev = 0.844118
- 1 item below graph minimum of -0.28207
- 78 items above graph maximum of 6.07192
|
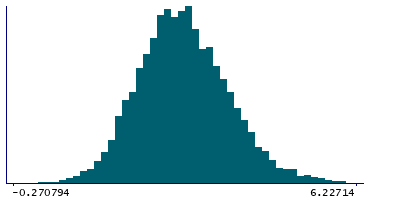
Instance 3 : First repeat imaging visit (2019+)
4,194 participants, 4,194 items
| Maximum | 6.78732 |
| Decile 9 | 4.06116 |
| Decile 8 | 3.65435 |
| Decile 7 | 3.36344 |
| Decile 6 | 3.11158 |
| Median | 2.91289 |
| Decile 4 | 2.69362 |
| Decile 3 | 2.48647 |
| Decile 2 | 2.22937 |
| Decile 1 | 1.89519 |
| Minimum | -0.536636 |
|
|
- Mean = 2.95464
- Std.dev = 0.860332
- 1 item below graph minimum of -0.270794
- 5 items above graph maximum of 6.22714
|
Notes
90th percentile of the z-statistic (in group-defined amygdala activation mask) for faces-shapes contrast (in task fMRI data, using cortical surface analysis)
1 Related Data-Field
| Field ID | Description | Relationship |
|---|
| 25768 | 90th percentile of z-statistic (in g ... | Field 25768 is an analogue for Current Field |


