Data
70,320 items of data are available, covering 66,459 participants.
Defined-instances run from 2 to 3, labelled using Instancing
2.
Units of measurement are percent.
| Maximum | 13.22 |
| Decile 9 | 2.092 |
| Decile 8 | 1.811 |
| Decile 7 | 1.631 |
| Decile 6 | 1.49 |
| Median | 1.366 |
| Decile 4 | 1.246 |
| Decile 3 | 1.125 |
| Decile 2 | 0.993 |
| Decile 1 | 0.815 |
| Minimum | -2.889 |
|

|
- Mean = 1.42224
- Std.dev = 0.545462
- 10 items below graph minimum of -0.462
- 321 items above graph maximum of 3.369
|
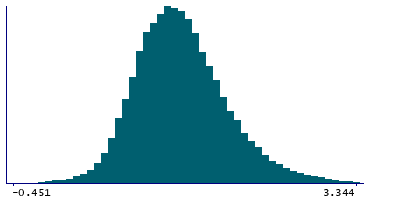
2 Instances
Instance 2 : Imaging visit (2014+)
66,036 participants, 66,036 items
| Maximum | 13.22 |
| Decile 9 | 2.099 |
| Decile 8 | 1.817 |
| Decile 7 | 1.6355 |
| Decile 6 | 1.494 |
| Median | 1.37 |
| Decile 4 | 1.25 |
| Decile 3 | 1.127 |
| Decile 2 | 0.993 |
| Decile 1 | 0.815 |
| Minimum | -2.889 |
|
|
- Mean = 1.42613
- Std.dev = 0.549535
- 10 items below graph minimum of -0.469
- 305 items above graph maximum of 3.383
|
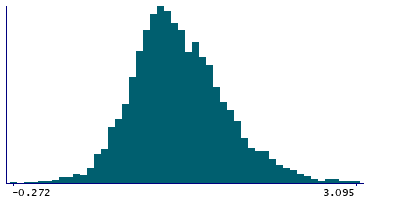
Instance 3 : First repeat imaging visit (2019+)
4,284 participants, 4,284 items
| Maximum | 4.148 |
| Decile 9 | 1.958 |
| Decile 8 | 1.715 |
| Decile 7 | 1.561 |
| Decile 6 | 1.431 |
| Median | 1.313 |
| Decile 4 | 1.203 |
| Decile 3 | 1.104 |
| Decile 2 | 0.986 |
| Decile 1 | 0.821 |
| Minimum | -0.272 |
|
|
- Mean = 1.3622
- Std.dev = 0.474278
- 16 items above graph maximum of 3.095
|