Data
68,033 items of data are available, covering 64,317 participants.
Defined-instances run from 2 to 3, labelled using Instancing
2.
Units of measurement are %.
| Maximum | 1229.63 |
| Decile 9 | 201.841 |
| Decile 8 | 174.15 |
| Decile 7 | 156.156 |
| Decile 6 | 142.217 |
| Median | 129.987 |
| Decile 4 | 118.409 |
| Decile 3 | 106.507 |
| Decile 2 | 93.625 |
| Decile 1 | 76.7053 |
| Minimum | -274.741 |
|

|
- Mean = 135.747
- Std.dev = 52.9786
- 11 items below graph minimum of -48.4299
- 276 items above graph maximum of 326.976
|
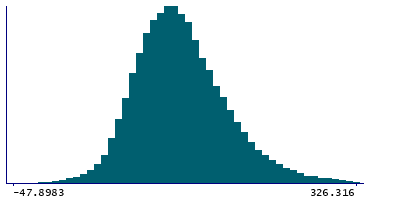
2 Instances
Instance 2 : Imaging visit (2014+)
63,839 participants, 63,839 items
| Maximum | 1229.63 |
| Decile 9 | 202.591 |
| Decile 8 | 174.831 |
| Decile 7 | 156.639 |
| Decile 6 | 142.533 |
| Median | 130.324 |
| Decile 4 | 118.713 |
| Decile 3 | 106.716 |
| Decile 2 | 93.6671 |
| Decile 1 | 76.6089 |
| Minimum | -274.741 |
|
|
- Mean = 136.097
- Std.dev = 53.3642
- 11 items below graph minimum of -49.3737
- 261 items above graph maximum of 328.574
|
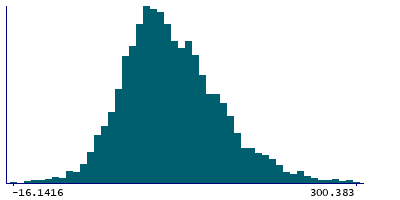
Instance 3 : First repeat imaging visit (2019+)
4,194 participants, 4,194 items
| Maximum | 368.678 |
| Decile 9 | 189.015 |
| Decile 8 | 166.607 |
| Decile 7 | 149.807 |
| Decile 6 | 137.051 |
| Median | 125.153 |
| Decile 4 | 114.74 |
| Decile 3 | 104.564 |
| Decile 2 | 93.1473 |
| Decile 1 | 77.6471 |
| Minimum | -16.1416 |
|
|
- Mean = 130.42
- Std.dev = 46.3929
- 15 items above graph maximum of 300.383
|
Notes
90th percentile of the BOLD effect (in group-defined mask) for faces-shapes contrast (in task fMRI data, using cortical surface analysis)
1 Related Data-Field
| Field ID | Description | Relationship |
|---|
| 25765 | 90th percentile of BOLD effect (in g ... | Field 25765 is an analogue for Current Field |


