Data
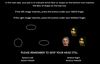
70,320 items of data are available, covering 66,459 participants.
Defined-instances run from 2 to 3, labelled using Instancing
2.
Units of measurement are Z.
| Maximum | 12.57 |
| Decile 9 | 8.133 |
| Decile 8 | 7.416 |
| Decile 7 | 6.896 |
| Decile 6 | 6.437 |
| Median | 6.004 |
| Decile 4 | 5.568 |
| Decile 3 | 5.089 |
| Decile 2 | 4.514 |
| Decile 1 | 3.701 |
| Minimum | -1.661 |
|
|
- Mean = 5.94585
- Std.dev = 1.75834
- 30 items below graph minimum of -0.731
- 1 item above graph maximum of 12.565
|
2 Instances
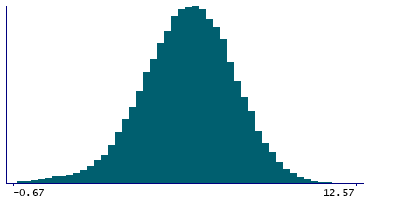
Instance 2 : Imaging visit (2014+)
66,036 participants, 66,036 items
| Maximum | 12.57 |
| Decile 9 | 8.128 |
| Decile 8 | 7.411 |
| Decile 7 | 6.888 |
| Decile 6 | 6.431 |
| Median | 5.997 |
| Decile 4 | 5.559 |
| Decile 3 | 5.081 |
| Decile 2 | 4.504 |
| Decile 1 | 3.69 |
| Minimum | -1.661 |
|
|
- Mean = 5.93746
- Std.dev = 1.76016
- 27 items below graph minimum of -0.748
- 1 item above graph maximum of 12.566
|
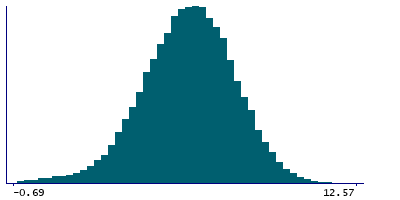
Instance 3 : First repeat imaging visit (2019+)
4,284 participants, 4,284 items
| Maximum | 11.83 |
| Decile 9 | 8.2195 |
| Decile 8 | 7.525 |
| Decile 7 | 7.0125 |
| Decile 6 | 6.539 |
| Median | 6.123 |
| Decile 4 | 5.684 |
| Decile 3 | 5.2285 |
| Decile 2 | 4.665 |
| Decile 1 | 3.914 |
| Minimum | -1.111 |
|
|
- Mean = 6.07511
- Std.dev = 1.72477
- 2 items below graph minimum of -0.3915
|