Data
68,033 items of data are available, covering 64,317 participants.
Defined-instances run from 2 to 3, labelled using Instancing
2.
Units of measurement are Z.
| Maximum | 12.952 |
| Decile 9 | 8.33853 |
| Decile 8 | 7.61594 |
| Decile 7 | 7.09014 |
| Decile 6 | 6.61985 |
| Median | 6.19506 |
| Decile 4 | 5.7388 |
| Decile 3 | 5.26451 |
| Decile 2 | 4.69016 |
| Decile 1 | 3.87664 |
| Minimum | -2.10855 |
|
|
- Mean = 6.12968
- Std.dev = 1.78653
- 65 items below graph minimum of -0.585263
- 2 items above graph maximum of 12.8004
|
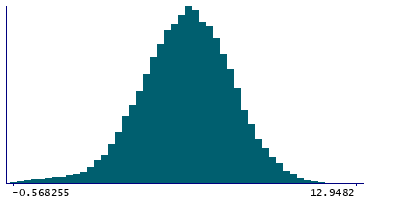
2 Instances
Instance 2 : Imaging visit (2014+)
63,839 participants, 63,839 items
| Maximum | 12.952 |
| Decile 9 | 8.33234 |
| Decile 8 | 7.61056 |
| Decile 7 | 7.08451 |
| Decile 6 | 6.61758 |
| Median | 6.19139 |
| Decile 4 | 5.73374 |
| Decile 3 | 5.25757 |
| Decile 2 | 4.68587 |
| Decile 1 | 3.8659 |
| Minimum | -2.10855 |
|

|
- Mean = 6.12372
- Std.dev = 1.78724
- 61 items below graph minimum of -0.600544
- 2 items above graph maximum of 12.7988
|
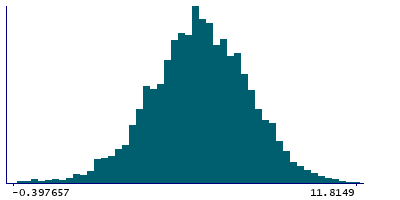
Instance 3 : First repeat imaging visit (2019+)
4,194 participants, 4,194 items
| Maximum | 11.8149 |
| Decile 9 | 8.4544 |
| Decile 8 | 7.68617 |
| Decile 7 | 7.16264 |
| Decile 6 | 6.66931 |
| Median | 6.23163 |
| Decile 4 | 5.83865 |
| Decile 3 | 5.3562 |
| Decile 2 | 4.80546 |
| Decile 1 | 4.02904 |
| Minimum | -1.27512 |
|
|
- Mean = 6.22033
- Std.dev = 1.77325
- 6 items below graph minimum of -0.396328
|
Notes
90th percentile of the z-statistic (in group-defined mask) for faces activation (in task fMRI data, using cortical surface analysis)
1 Related Data-Field
| Field ID | Description | Relationship |
|---|
| 25764 | 90th percentile of z-statistic (in g ... | Field 25764 is an analogue for Current Field |


