Data
70,320 items of data are available, covering 66,459 participants.
Defined-instances run from 2 to 3, labelled using Instancing
2.
Units of measurement are Z.
| Maximum | 161.3 |
| Decile 9 | 7.595 |
| Decile 8 | 6.865 |
| Decile 7 | 6.341 |
| Decile 6 | 5.891 |
| Median | 5.466 |
| Decile 4 | 5.034 |
| Decile 3 | 4.576 |
| Decile 2 | 4.026 |
| Decile 1 | 3.265 |
| Minimum | -1.55 |
|

|
- Mean = 5.43718
- Std.dev = 1.81038
- 9 items below graph minimum of -1.065
- 4 items above graph maximum of 11.925
|
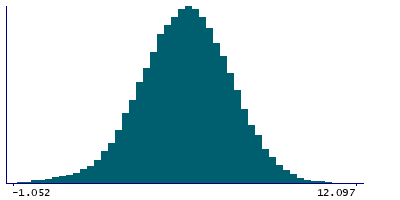
2 Instances
Instance 2 : Imaging visit (2014+)
66,036 participants, 66,036 items
| Maximum | 161.3 |
| Decile 9 | 7.591 |
| Decile 8 | 6.862 |
| Decile 7 | 6.334 |
| Decile 6 | 5.882 |
| Median | 5.459 |
| Decile 4 | 5.025 |
| Decile 3 | 4.567 |
| Decile 2 | 4.015 |
| Decile 1 | 3.257 |
| Minimum | -1.55 |
|
|
- Mean = 5.43014
- Std.dev = 1.81841
- 9 items below graph minimum of -1.077
- 4 items above graph maximum of 11.925
|
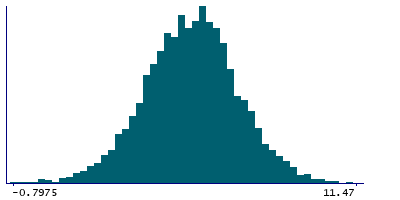
Instance 3 : First repeat imaging visit (2019+)
4,284 participants, 4,284 items
| Maximum | 11.47 |
| Decile 9 | 7.6475 |
| Decile 8 | 6.896 |
| Decile 7 | 6.414 |
| Decile 6 | 5.9975 |
| Median | 5.594 |
| Decile 4 | 5.166 |
| Decile 3 | 4.701 |
| Decile 2 | 4.187 |
| Decile 1 | 3.429 |
| Minimum | -1.055 |
|
|
- Mean = 5.54566
- Std.dev = 1.67808
- 2 items below graph minimum of -0.7895
- 1 item above graph maximum of 11.47
|