Data
68,033 items of data are available, covering 64,317 participants.
Defined-instances run from 2 to 3, labelled using Instancing
2.
Units of measurement are Z.
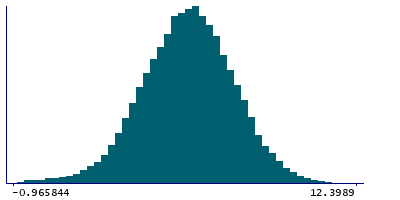
| Maximum | 12.3989 |
| Decile 9 | 7.9576 |
| Decile 8 | 7.2017 |
| Decile 7 | 6.66244 |
| Decile 6 | 6.1986 |
| Median | 5.76346 |
| Decile 4 | 5.32325 |
| Decile 3 | 4.8407 |
| Decile 2 | 4.27514 |
| Decile 1 | 3.48889 |
| Minimum | -2.31507 |
|
|
- Mean = 5.72688
- Std.dev = 1.77937
- 31 items below graph minimum of -0.97983
|
2 Instances
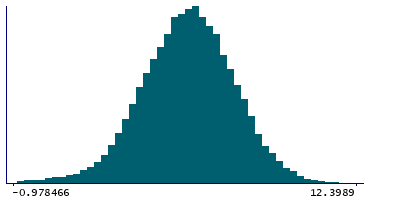
Instance 2 : Imaging visit (2014+)
63,839 participants, 63,839 items
| Maximum | 12.3989 |
| Decile 9 | 7.9553 |
| Decile 8 | 7.19588 |
| Decile 7 | 6.65806 |
| Decile 6 | 6.19166 |
| Median | 5.75639 |
| Decile 4 | 5.31636 |
| Decile 3 | 4.83478 |
| Decile 2 | 4.2661 |
| Decile 1 | 3.48075 |
| Minimum | -2.31507 |
|
|
- Mean = 5.7203
- Std.dev = 1.77982
- 27 items below graph minimum of -0.993791
|
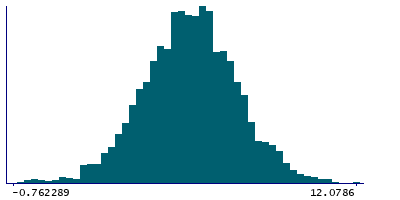
Instance 3 : First repeat imaging visit (2019+)
4,194 participants, 4,194 items
| Maximum | 12.0786 |
| Decile 9 | 7.99932 |
| Decile 8 | 7.27765 |
| Decile 7 | 6.71726 |
| Decile 6 | 6.29829 |
| Median | 5.85604 |
| Decile 4 | 5.42245 |
| Decile 3 | 4.9694 |
| Decile 2 | 4.40417 |
| Decile 1 | 3.61982 |
| Minimum | -1.40147 |
|
|
- Mean = 5.82696
- Std.dev = 1.76951
- 5 items below graph minimum of -0.75968
- 1 item above graph maximum of 12.0786
|
Notes
90th percentile of the z-statistic (in group-defined mask) for shapes activation (in task fMRI data, using cortical surface analysis)
1 Related Data-Field
| Field ID | Description | Relationship |
|---|
| 25762 | 90th percentile of z-statistic (in g ... | Field 25762 is an analogue for Current Field |


