Data
83,911 items of data are available, covering 79,384 participants.
Defined-instances run from 2 to 3, labelled using Instancing
2.
Units of measurement are AU.
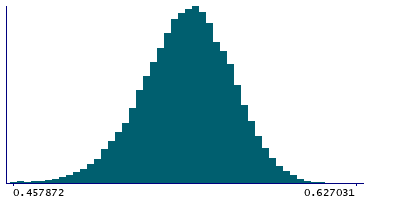
| Maximum | 0.730463 |
| Decile 9 | 0.570369 |
| Decile 8 | 0.561628 |
| Decile 7 | 0.554975 |
| Decile 6 | 0.549238 |
| Median | 0.543758 |
| Decile 4 | 0.53821 |
| Decile 3 | 0.532066 |
| Decile 2 | 0.524614 |
| Decile 1 | 0.513933 |
| Minimum | 0 |
|
|
- Mean = 0.542588
- Std.dev = 0.0232263
- 187 items below graph minimum of 0.457496
- 1 item above graph maximum of 0.626806
|
2 Instances
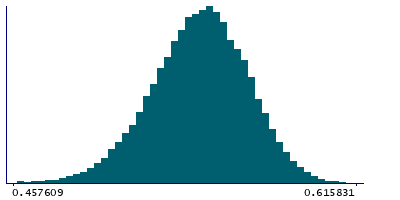
Instance 2 : Imaging visit (2014+)
79,153 participants, 79,153 items
| Maximum | 0.622991 |
| Decile 9 | 0.570462 |
| Decile 8 | 0.561716 |
| Decile 7 | 0.555073 |
| Decile 6 | 0.549329 |
| Median | 0.543833 |
| Decile 4 | 0.538273 |
| Decile 3 | 0.532086 |
| Decile 2 | 0.524631 |
| Decile 1 | 0.513896 |
| Minimum | 0 |
|
|
- Mean = 0.54263
- Std.dev = 0.0232975
- 174 items below graph minimum of 0.45733
|
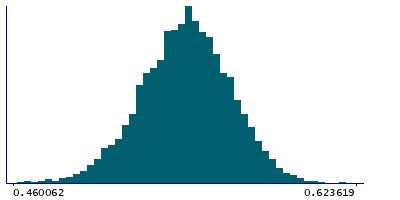
Instance 3 : First repeat imaging visit (2019+)
4,758 participants, 4,758 items
| Maximum | 0.730463 |
| Decile 9 | 0.569103 |
| Decile 8 | 0.559913 |
| Decile 7 | 0.553325 |
| Decile 6 | 0.54758 |
| Median | 0.542737 |
| Decile 4 | 0.537388 |
| Decile 3 | 0.531648 |
| Decile 2 | 0.524247 |
| Decile 1 | 0.514566 |
| Minimum | 0.356893 |
|
|
- Mean = 0.541887
- Std.dev = 0.0219964
- 11 items below graph minimum of 0.460028
- 1 item above graph maximum of 0.623641
|
Notes
Mean FA (fractional anisotropy) in middle cerebellar peduncle on FA skeleton (from dMRI data)
0 Related Data-Fields
There are no related data-fields
2 Applications
| Application ID | Title |
|---|
| 17689 | Genetic, environmental and lifestyle predictors of brain/cognitive-related outcomes. |
| 22783 | The joint analysis of imaging data and genetic data for early tumor detection, prevention, diagnosis and treatment |

