Data
445,581 items of data are available, covering 351,226 participants.
Some values have special meanings defined by Data-Coding
100291.
Defined-instances run from 0 to 3, labelled using Instancing
2.
Units of measurement are glasses.
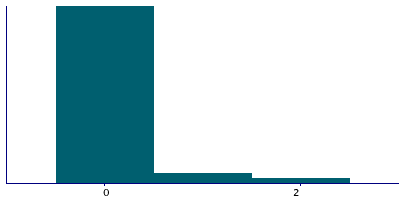
| Maximum | 112 |
| Decile 9 | 0 |
| Decile 8 | 0 |
| Decile 7 | 0 |
| Decile 6 | 0 |
| Median | 0 |
| Decile 4 | 0 |
| Decile 3 | 0 |
| Decile 2 | 0 |
| Decile 1 | 0 |
| Minimum | 0 |
|

|
- There are 41 distinct values.
- Mean = 0.227526
- Std.dev = 1.21756
- 20650 items above graph maximum of 1
- 409 items have value -3 (Prefer not to answer)
- 1425 items have value -1 (Do not know)
|
4 Instances
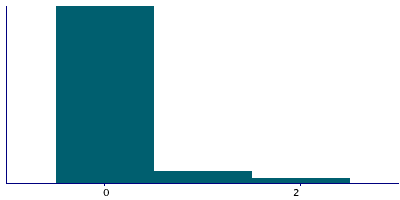
Instance 0 : Initial assessment visit (2006-2010) at which participants were recruited and consent given
346,120 participants, 346,120 items
| Maximum | 112 |
| Decile 9 | 1 |
| Decile 8 | 0 |
| Decile 7 | 0 |
| Decile 6 | 0 |
| Median | 0 |
| Decile 4 | 0 |
| Decile 3 | 0 |
| Decile 2 | 0 |
| Decile 1 | 0 |
| Minimum | 0 |
|
|
- There are 40 distinct values.
- Mean = 0.238504
- Std.dev = 1.2729
- 8329 items above graph maximum of 2
- 373 items have value -3 (Prefer not to answer)
- 1283 items have value -1 (Do not know)
|
Instance 1 : First repeat assessment visit (2012-13)
14,494 participants, 14,494 items
| Maximum | 40 |
| Decile 9 | 1 |
| Decile 8 | 0 |
| Decile 7 | 0 |
| Decile 6 | 0 |
| Median | 0 |
| Decile 4 | 0 |
| Decile 3 | 0 |
| Decile 2 | 0 |
| Decile 1 | 0 |
| Minimum | 0 |
|
|
- There are 16 distinct values.
- Mean = 0.23694
- Std.dev = 1.02446
- 354 items above graph maximum of 2
- 4 items have value -3 (Prefer not to answer)
- 18 items have value -1 (Do not know)
|
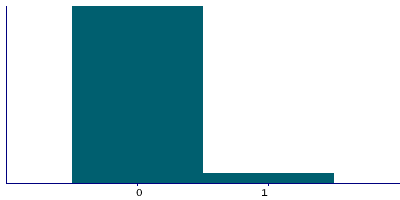
Instance 2 : Imaging visit (2014+)
70,511 participants, 70,511 items
| Maximum | 84 |
| Decile 9 | 0 |
| Decile 8 | 0 |
| Decile 7 | 0 |
| Decile 6 | 0 |
| Median | 0 |
| Decile 4 | 0 |
| Decile 3 | 0 |
| Decile 2 | 0 |
| Decile 1 | 0 |
| Minimum | 0 |
|
|
- There are 26 distinct values.
- Mean = 0.183056
- Std.dev = 0.995684
- 2695 items above graph maximum of 1
- 31 items have value -3 (Prefer not to answer)
- 108 items have value -1 (Do not know)
|
Instance 3 : First repeat imaging visit (2019+)
14,456 participants, 14,456 items
| Maximum | 50 |
| Decile 9 | 0 |
| Decile 8 | 0 |
| Decile 7 | 0 |
| Decile 6 | 0 |
| Median | 0 |
| Decile 4 | 0 |
| Decile 3 | 0 |
| Decile 2 | 0 |
| Decile 1 | 0 |
| Minimum | 0 |
|

|
- There are 16 distinct values.
- Mean = 0.172934
- Std.dev = 1.00326
- 517 items above graph maximum of 1
- 1 items have value -3 (Prefer not to answer)
- 16 items have value -1 (Do not know)
|
Notes
ACE touchscreen question "In an average WEEK, how many glasses of fortified wine would you drink? (There are 12 glasses in an average bottle) (Fortified wines include drinks such as sherry, port, vermouth)"
The following checks were performed:
- If answer < 0 then rejected
- If answer > 250 then rejected
- If answer > 100 then participant asked to confirm
If the participant activated the Help button they were shown the message:
Fortified wines include: Sherry, Port, Vermouth, Muscat,
Madeira, Malaga, Tokay, Frontignan, Frontignac.
|
Field 1608 was collected from participants who indicated they drink alcohol more often than once or twice a week, as defined by their answers to Field 1558
Coding 100291 defines 2 special values:
- -1 represents "Do not know"
- -3 represents "Prefer not to answer"
1 Related Data-Field
| Field ID | Description | Relationship |
|---|
| 1558 | Alcohol intake frequency. | Current Field was collected from participants who indicated they drink alcohol more often than once or twice a week, as defined by their answers to Field 1558 |
1 Application
| Application ID | Title |
|---|
| 31187 | Integrative Prioritization of Loci for Alcohol Use Disorders and Associated Complex Traits |


