Data
445,581 items of data are available, covering 351,226 participants.
Some values have special meanings defined by Data-Coding
100291.
Defined-instances run from 0 to 3, labelled using Instancing
2.
Units of measurement are glasses.
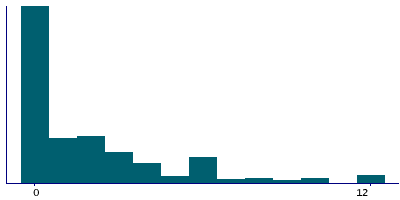
| Maximum | 240 |
| Decile 9 | 6 |
| Decile 8 | 4 |
| Decile 7 | 3 |
| Decile 6 | 2 |
| Median | 1 |
| Decile 4 | 0 |
| Decile 3 | 0 |
| Decile 2 | 0 |
| Decile 1 | 0 |
| Minimum | 0 |
|
|
- There are 71 distinct values.
- Mean = 2.62074
- Std.dev = 4.63316
- 14973 items above graph maximum of 12
- 514 items have value -3 (Prefer not to answer)
- 2246 items have value -1 (Do not know)
|
4 Instances
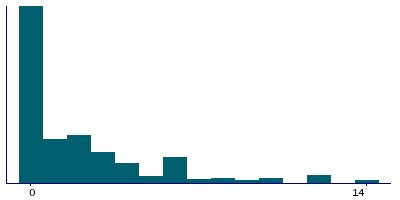
Instance 0 : Initial assessment visit (2006-2010) at which participants were recruited and consent given
346,120 participants, 346,120 items
| Maximum | 240 |
| Decile 9 | 7 |
| Decile 8 | 4 |
| Decile 7 | 3 |
| Decile 6 | 2 |
| Median | 1 |
| Decile 4 | 0 |
| Decile 3 | 0 |
| Decile 2 | 0 |
| Decile 1 | 0 |
| Minimum | 0 |
|
|
- There are 69 distinct values.
- Mean = 2.65391
- Std.dev = 4.71167
- 9765 items above graph maximum of 14
- 449 items have value -3 (Prefer not to answer)
- 1987 items have value -1 (Do not know)
|
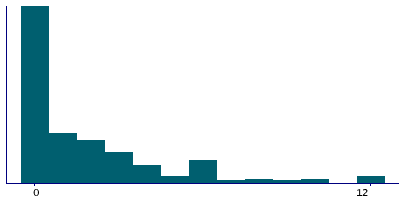
Instance 1 : First repeat assessment visit (2012-13)
14,494 participants, 14,494 items
| Maximum | 50 |
| Decile 9 | 6 |
| Decile 8 | 4 |
| Decile 7 | 2 |
| Decile 6 | 2 |
| Median | 1 |
| Decile 4 | 0 |
| Decile 3 | 0 |
| Decile 2 | 0 |
| Decile 1 | 0 |
| Minimum | 0 |
|
|
- There are 35 distinct values.
- Mean = 2.35669
- Std.dev = 4.1925
- 395 items above graph maximum of 12
- 6 items have value -3 (Prefer not to answer)
- 33 items have value -1 (Do not know)
|
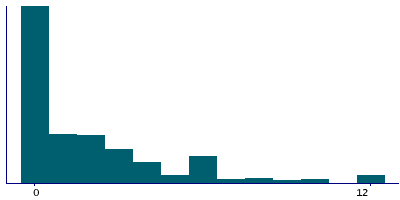
Instance 2 : Imaging visit (2014+)
70,511 participants, 70,511 items
| Maximum | 84 |
| Decile 9 | 6 |
| Decile 8 | 4 |
| Decile 7 | 3 |
| Decile 6 | 2 |
| Median | 1 |
| Decile 4 | 0 |
| Decile 3 | 0 |
| Decile 2 | 0 |
| Decile 1 | 0 |
| Minimum | 0 |
|
|
- There are 50 distinct values.
- Mean = 2.55401
- Std.dev = 4.39499
- 2072 items above graph maximum of 12
- 52 items have value -3 (Prefer not to answer)
- 195 items have value -1 (Do not know)
|
Instance 3 : First repeat imaging visit (2019+)
14,456 participants, 14,456 items
| Maximum | 84 |
| Decile 9 | 6 |
| Decile 8 | 4 |
| Decile 7 | 3 |
| Decile 6 | 2 |
| Median | 1 |
| Decile 4 | 0 |
| Decile 3 | 0 |
| Decile 2 | 0 |
| Decile 1 | 0 |
| Minimum | 0 |
|

|
- There are 34 distinct values.
- Mean = 2.41996
- Std.dev = 4.26594
- 398 items above graph maximum of 12
- 7 items have value -3 (Prefer not to answer)
- 31 items have value -1 (Do not know)
|
Notes
ACE touchscreen question "In an average WEEK, how many glasses of WHITE wine or champagne would you drink? (There are six glasses in an average bottle)"
The following checks were performed:
- If answer < 0 then rejected
- If answer > 250 then rejected
- If answer > 100 then participant asked to confirm
If the participant activated the Help button they were shown the message:
Please include sparkling white wine here.
|
Field 1578 was collected from participants who indicated they drink alcohol more often than once or twice a week, as defined by their answers to Field 1558
Coding 100291 defines 2 special values:
- -1 represents "Do not know"
- -3 represents "Prefer not to answer"
1 Related Data-Field
| Field ID | Description | Relationship |
|---|
| 1558 | Alcohol intake frequency. | Current Field was collected from participants who indicated they drink alcohol more often than once or twice a week, as defined by their answers to Field 1558 |
1 Application
| Application ID | Title |
|---|
| 31187 | Integrative Prioritization of Loci for Alcohol Use Disorders and Associated Complex Traits |


