Data
445,582 items of data are available, covering 351,227 participants.
Some values have special meanings defined by Data-Coding
100291.
Defined-instances run from 0 to 3, labelled using Instancing
2.
Units of measurement are glasses.
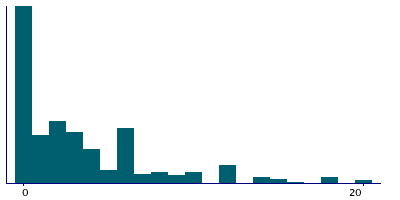
| Maximum | 122 |
| Decile 9 | 10 |
| Decile 8 | 6 |
| Decile 7 | 4 |
| Decile 6 | 3 |
| Median | 2 |
| Decile 4 | 1 |
| Decile 3 | 0 |
| Decile 2 | 0 |
| Decile 1 | 0 |
| Minimum | 0 |
|
|
- There are 76 distinct values.
- Mean = 3.82664
- Std.dev = 5.46428
- 8188 items above graph maximum of 20
- 519 items have value -3 (Prefer not to answer)
- 1947 items have value -1 (Do not know)
|
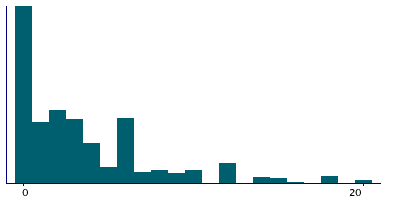
4 Instances
Instance 0 : Initial assessment visit (2006-2010) at which participants were recruited and consent given
346,121 participants, 346,121 items
| Maximum | 122 |
| Decile 9 | 10 |
| Decile 8 | 6 |
| Decile 7 | 5 |
| Decile 6 | 3 |
| Median | 2 |
| Decile 4 | 1 |
| Decile 3 | 0 |
| Decile 2 | 0 |
| Decile 1 | 0 |
| Minimum | 0 |
|

|
- There are 73 distinct values.
- Mean = 3.91505
- Std.dev = 5.5819
- 6757 items above graph maximum of 20
- 448 items have value -3 (Prefer not to answer)
- 1725 items have value -1 (Do not know)
|
Instance 1 : First repeat assessment visit (2012-13)
14,494 participants, 14,494 items
| Maximum | 90 |
| Decile 9 | 10 |
| Decile 8 | 6 |
| Decile 7 | 5 |
| Decile 6 | 3 |
| Median | 2 |
| Decile 4 | 2 |
| Decile 3 | 1 |
| Decile 2 | 0 |
| Decile 1 | 0 |
| Minimum | 0 |
|
|
- There are 45 distinct values.
- Mean = 3.9014
- Std.dev = 5.37285
- 250 items above graph maximum of 20
- 3 items have value -3 (Prefer not to answer)
- 29 items have value -1 (Do not know)
|
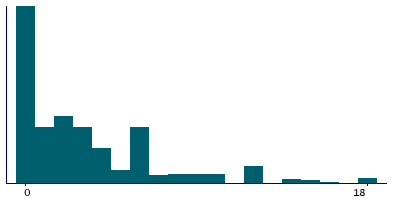
Instance 2 : Imaging visit (2014+)
70,511 participants, 70,511 items
| Maximum | 120 |
| Decile 9 | 9 |
| Decile 8 | 6 |
| Decile 7 | 4 |
| Decile 6 | 3 |
| Median | 2 |
| Decile 4 | 1 |
| Decile 3 | 0 |
| Decile 2 | 0 |
| Decile 1 | 0 |
| Minimum | 0 |
|
|
- There are 56 distinct values.
- Mean = 3.47896
- Std.dev = 4.97978
- 1291 items above graph maximum of 18
- 59 items have value -3 (Prefer not to answer)
- 170 items have value -1 (Do not know)
|
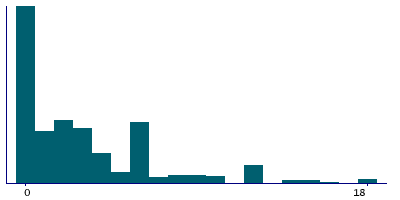
Instance 3 : First repeat imaging visit (2019+)
14,456 participants, 14,456 items
| Maximum | 63 |
| Decile 9 | 8 |
| Decile 8 | 6 |
| Decile 7 | 4 |
| Decile 6 | 3 |
| Median | 2 |
| Decile 4 | 1 |
| Decile 3 | 0 |
| Decile 2 | 0 |
| Decile 1 | 0 |
| Minimum | 0 |
|
|
- There are 40 distinct values.
- Mean = 3.33763
- Std.dev = 4.84824
- 355 items above graph maximum of 16
- 9 items have value -3 (Prefer not to answer)
- 23 items have value -1 (Do not know)
|
Notes
ACE touchscreen question "In an average WEEK, how many glasses of RED wine would you drink? (There are six glasses in an average bottle)"
The following checks were performed:
- If answer < 0 then rejected
- If answer > 250 then rejected
- If answer > 100 then participant asked to confirm
If the participant activated the Help button they were shown the message:
Please include sparkling red wine here.
|
Field 1568 was collected from participants who indicated they drink alcohol more often than once or twice a week, as defined by their answers to Field 1558
Coding 100291 defines 2 special values:
- -1 represents "Do not know"
- -3 represents "Prefer not to answer"
1 Related Data-Field
| Field ID | Description | Relationship |
|---|
| 1558 | Alcohol intake frequency. | Current Field was collected from participants who indicated they drink alcohol more often than once or twice a week, as defined by their answers to Field 1558 |
1 Application
| Application ID | Title |
|---|
| 31187 | Integrative Prioritization of Loci for Alcohol Use Disorders and Associated Complex Traits |


