Data
572,374 items of data are available, covering 492,409 participants.
Defined-instances run from 0 to 3, labelled using Instancing
2.
Units of measurement are Kg.
| Maximum | 37.2 |
| Decile 9 | 4.1 |
| Decile 8 | 3.7 |
| Decile 7 | 3.4 |
| Decile 6 | 3.1 |
| Median | 2.7 |
| Decile 4 | 2.5 |
| Decile 3 | 2.3 |
| Decile 2 | 2.2 |
| Decile 1 | 2 |
| Minimum | 0.9 |
|

|
- Mean = 2.92257
- Std.dev = 0.832398
- 199 items above graph maximum of 6.2
|
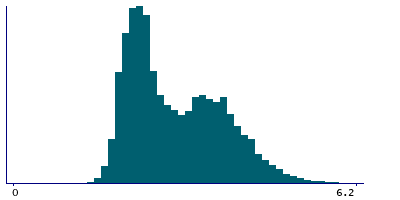
4 Instances
Instance 0 : Initial assessment visit (2006-2010) at which participants were recruited and consent given
491,580 participants, 491,580 items
| Maximum | 37.2 |
| Decile 9 | 4.1 |
| Decile 8 | 3.7 |
| Decile 7 | 3.4 |
| Decile 6 | 3.1 |
| Median | 2.7 |
| Decile 4 | 2.5 |
| Decile 3 | 2.3 |
| Decile 2 | 2.2 |
| Decile 1 | 2 |
| Minimum | 0.9 |
|
|
- Mean = 2.92578
- Std.dev = 0.837264
- 173 items above graph maximum of 6.2
|
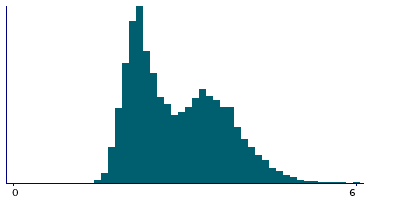
Instance 1 : First repeat assessment visit (2012-13)
20,022 participants, 20,022 items
| Maximum | 6.9 |
| Decile 9 | 4 |
| Decile 8 | 3.6 |
| Decile 7 | 3.3 |
| Decile 6 | 3.1 |
| Median | 2.7 |
| Decile 4 | 2.5 |
| Decile 3 | 2.3 |
| Decile 2 | 2.1 |
| Decile 1 | 2 |
| Minimum | 1.3 |
|
|
- Mean = 2.87592
- Std.dev = 0.789385
- 4 items above graph maximum of 6
|
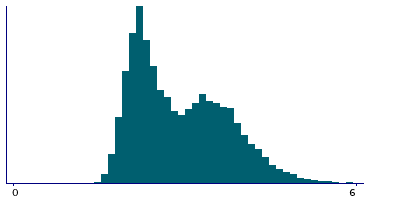
Instance 2 : Imaging visit (2014+)
55,607 participants, 55,607 items
| Maximum | 7 |
| Decile 9 | 4 |
| Decile 8 | 3.7 |
| Decile 7 | 3.4 |
| Decile 6 | 3.1 |
| Median | 2.7 |
| Decile 4 | 2.5 |
| Decile 3 | 2.3 |
| Decile 2 | 2.2 |
| Decile 1 | 2 |
| Minimum | 1.3 |
|
|
- Mean = 2.91269
- Std.dev = 0.805969
- 27 items above graph maximum of 6
|
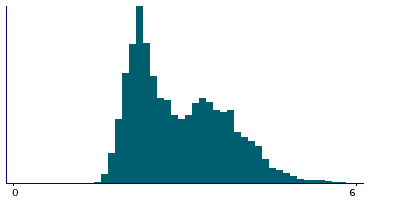
Instance 3 : First repeat imaging visit (2019+)
5,165 participants, 5,165 items
| Maximum | 6.7 |
| Decile 9 | 4 |
| Decile 8 | 3.7 |
| Decile 7 | 3.4 |
| Decile 6 | 3.1 |
| Median | 2.7 |
| Decile 4 | 2.5 |
| Decile 3 | 2.3 |
| Decile 2 | 2.2 |
| Decile 1 | 2 |
| Minimum | 1.4 |
|
|
- Mean = 2.90403
- Std.dev = 0.803448
- 2 items above graph maximum of 6
|
Notes
Body composition estimation by impedance measurement. Left arm fat free mass
Left arm fat free mass in Kg, 0.1 increments.


