Data
572,463 items of data are available, covering 492,487 participants.
Defined-instances run from 0 to 3, labelled using Instancing
2.
Units of measurement are Kg.
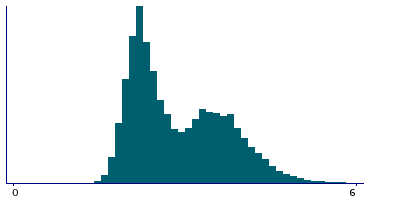
| Maximum | 26 |
| Decile 9 | 4 |
| Decile 8 | 3.7 |
| Decile 7 | 3.4 |
| Decile 6 | 3 |
| Median | 2.7 |
| Decile 4 | 2.4 |
| Decile 3 | 2.3 |
| Decile 2 | 2.1 |
| Decile 1 | 2 |
| Minimum | 0.7 |
|
|
- Mean = 2.88775
- Std.dev = 0.814612
- 214 items above graph maximum of 6
|
4 Instances
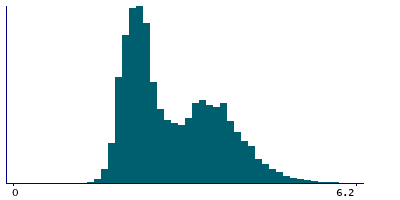
Instance 0 : Initial assessment visit (2006-2010) at which participants were recruited and consent given
491,669 participants, 491,669 items
| Maximum | 26 |
| Decile 9 | 4.1 |
| Decile 8 | 3.7 |
| Decile 7 | 3.4 |
| Decile 6 | 3.1 |
| Median | 2.7 |
| Decile 4 | 2.4 |
| Decile 3 | 2.3 |
| Decile 2 | 2.1 |
| Decile 1 | 2 |
| Minimum | 0.7 |
|
|
- Mean = 2.89329
- Std.dev = 0.821578
- 131 items above graph maximum of 6.2
|
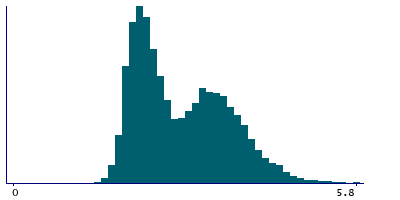
Instance 1 : First repeat assessment visit (2012-13)
20,022 participants, 20,022 items
| Maximum | 6.9 |
| Decile 9 | 3.9 |
| Decile 8 | 3.6 |
| Decile 7 | 3.3 |
| Decile 6 | 3 |
| Median | 2.7 |
| Decile 4 | 2.4 |
| Decile 3 | 2.2 |
| Decile 2 | 2.1 |
| Decile 1 | 2 |
| Minimum | 1 |
|
|
- Mean = 2.83873
- Std.dev = 0.771599
- 9 items above graph maximum of 5.8
|
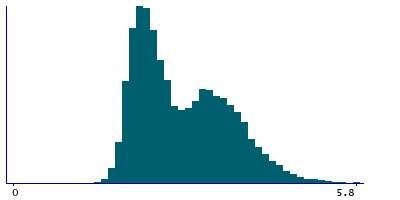
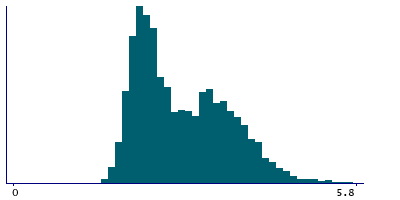
Instance 2 : Imaging visit (2014+)
55,607 participants, 55,607 items
| Maximum | 6.8 |
| Decile 9 | 3.9 |
| Decile 8 | 3.6 |
| Decile 7 | 3.3 |
| Decile 6 | 3 |
| Median | 2.7 |
| Decile 4 | 2.4 |
| Decile 3 | 2.3 |
| Decile 2 | 2.1 |
| Decile 1 | 2 |
| Minimum | 1.3 |
|
|
- Mean = 2.85949
- Std.dev = 0.769672
- 31 items above graph maximum of 5.8
|
Instance 3 : First repeat imaging visit (2019+)
5,165 participants, 5,165 items
| Maximum | 6.5 |
| Decile 9 | 3.9 |
| Decile 8 | 3.6 |
| Decile 7 | 3.3 |
| Decile 6 | 3 |
| Median | 2.7 |
| Decile 4 | 2.4 |
| Decile 3 | 2.3 |
| Decile 2 | 2.1 |
| Decile 1 | 2 |
| Minimum | 1.5 |
|
|
- Mean = 2.8547
- Std.dev = 0.766584
- 2 items above graph maximum of 5.8
|
Notes
Body composition estimation by impedance measurement. Right arm fat free mass
Right arm fat free mass in Kg, 0.1 increments.


