Data
118,528 items of data are available, covering 111,246 participants.
Defined-instances run from 0 to 3, labelled using Instancing
2.
Units of measurement are seconds.
| Maximum | 3386 |
| Decile 9 | 669 |
| Decile 8 | 575 |
| Decile 7 | 521 |
| Decile 6 | 482 |
| Median | 449 |
| Decile 4 | 418 |
| Decile 3 | 384 |
| Decile 2 | 341 |
| Decile 1 | 257.5 |
| Minimum | 3 |
|
|
- There are 1541 distinct values.
- Mean = 462.851
- Std.dev = 185.668
- 1055 items above graph maximum of 1080
|
4 Instances
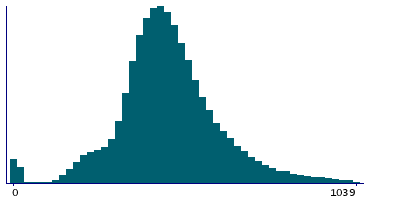
Instance 0 : Initial assessment visit (2006-2010) at which participants were recruited and consent given
78,756 participants, 78,756 items
| Maximum | 3386 |
| Decile 9 | 682 |
| Decile 8 | 588 |
| Decile 7 | 536 |
| Decile 6 | 498 |
| Median | 466 |
| Decile 4 | 437 |
| Decile 3 | 407 |
| Decile 2 | 373 |
| Decile 1 | 322 |
| Minimum | 13 |
|
|
- There are 1418 distinct values.
- Mean = 489.348
- Std.dev = 165.826
- 831 items above graph maximum of 1042
|
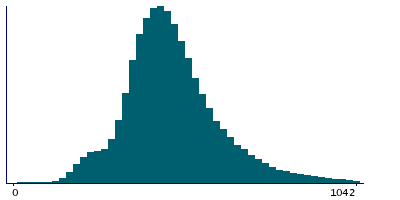
Instance 1 : First repeat assessment visit (2012-13)
19,989 participants, 19,989 items
| Maximum | 2475 |
| Decile 9 | 654 |
| Decile 8 | 575 |
| Decile 7 | 530 |
| Decile 6 | 497 |
| Median | 470 |
| Decile 4 | 445 |
| Decile 3 | 420 |
| Decile 2 | 394 |
| Decile 1 | 361 |
| Minimum | 19 |
|
|
- There are 992 distinct values.
- Mean = 493.806
- Std.dev = 139.504
- 226 items above graph maximum of 947
|
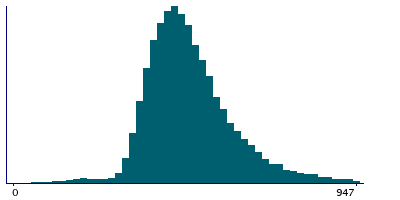
Instance 2 : Imaging visit (2014+)
4,182 participants, 4,182 items
| Maximum | 1876 |
| Decile 9 | 538 |
| Decile 8 | 429 |
| Decile 7 | 368 |
| Decile 6 | 321 |
| Median | 280 |
| Decile 4 | 238 |
| Decile 3 | 191 |
| Decile 2 | 14.5 |
| Decile 1 | 8 |
| Minimum | 3 |
|
|
- There are 756 distinct values.
- Mean = 289.255
- Std.dev = 230.702
- 41 items above graph maximum of 1068
|
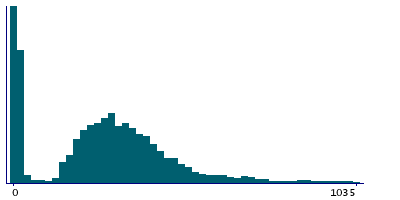
Instance 3 : First repeat imaging visit (2019+)
15,601 participants, 15,601 items
| Maximum | 3338 |
| Decile 9 | 615 |
| Decile 8 | 445 |
| Decile 7 | 375 |
| Decile 6 | 332 |
| Median | 298 |
| Decile 4 | 264 |
| Decile 3 | 227.5 |
| Decile 2 | 192 |
| Decile 1 | 24 |
| Minimum | 3 |
|

|
- There are 1187 distinct values.
- Mean = 335.961
- Std.dev = 234.384
- 135 items above graph maximum of 1206
|


