Data
118,522 items of data are available, covering 111,243 participants.
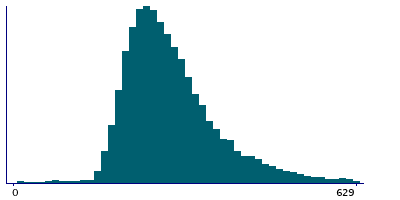
Defined-instances run from 0 to 3, labelled using Instancing
2.
Units of measurement are seconds.
| Maximum | 2140 |
| Decile 9 | 413 |
| Decile 8 | 350 |
| Decile 7 | 313 |
| Decile 6 | 286 |
| Median | 263 |
| Decile 4 | 241 |
| Decile 3 | 218 |
| Decile 2 | 183 |
| Decile 1 | 3 |
| Minimum | 1 |
|
|
- There are 1058 distinct values.
- Mean = 255
- Std.dev = 148.499
- 384 items above graph maximum of 823
|
4 Instances
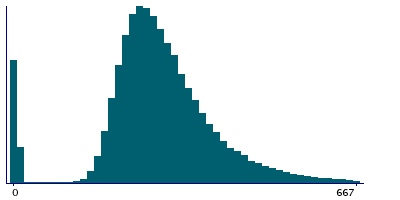
Instance 0 : Initial assessment visit (2006-2010) at which participants were recruited and consent given
78,758 participants, 78,758 items
| Maximum | 2065 |
| Decile 9 | 434 |
| Decile 8 | 368 |
| Decile 7 | 332 |
| Decile 6 | 306 |
| Median | 284 |
| Decile 4 | 264 |
| Decile 3 | 246 |
| Decile 2 | 227 |
| Decile 1 | 204 |
| Minimum | 13 |
|
|
- There are 972 distinct values.
- Mean = 306.482
- Std.dev = 106.916
- 949 items above graph maximum of 664
|
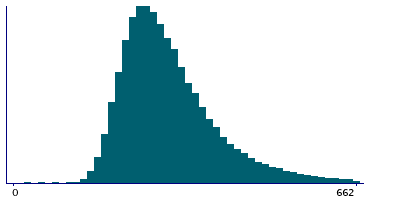
Instance 1 : First repeat assessment visit (2012-13)
19,981 participants, 19,981 items
| Maximum | 2140 |
| Decile 9 | 415 |
| Decile 8 | 353 |
| Decile 7 | 319 |
| Decile 6 | 294 |
| Median | 274 |
| Decile 4 | 256 |
| Decile 3 | 239 |
| Decile 2 | 222 |
| Decile 1 | 201 |
| Minimum | 9 |
|
|
- There are 741 distinct values.
- Mean = 295.525
- Std.dev = 103.459
- 245 items above graph maximum of 629
|
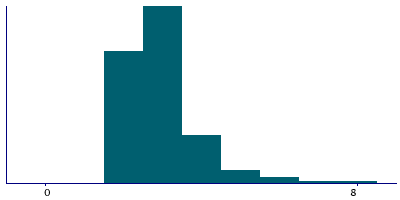
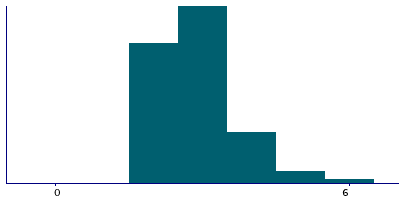
Instance 2 : Imaging visit (2014+)
4,182 participants, 4,182 items
| Maximum | 1142 |
| Decile 9 | 5 |
| Decile 8 | 4 |
| Decile 7 | 3 |
| Decile 6 | 3 |
| Median | 3 |
| Decile 4 | 3 |
| Decile 3 | 2 |
| Decile 2 | 2 |
| Decile 1 | 2 |
| Minimum | 1 |
|
|
- There are 119 distinct values.
- Mean = 7.97418
- Std.dev = 41.7987
- 185 items above graph maximum of 8
|
Instance 3 : First repeat imaging visit (2019+)
15,601 participants, 15,601 items
| Maximum | 1692 |
| Decile 9 | 5 |
| Decile 8 | 4 |
| Decile 7 | 3 |
| Decile 6 | 3 |
| Median | 3 |
| Decile 4 | 3 |
| Decile 3 | 2 |
| Decile 2 | 2 |
| Decile 1 | 2 |
| Minimum | 1 |
|
|
- There are 273 distinct values.
- Mean = 9.4251
- Std.dev = 59.1516
- 562 items above graph maximum of 8
|


