Data
286,819 items of data are available, covering 236,313 participants.
Defined-instances run from 0 to 3, labelled using Instancing
2.
Units of measurement are bpm.
| Maximum | 192 |
| Decile 9 | 84 |
| Decile 8 | 77 |
| Decile 7 | 73 |
| Decile 6 | 70 |
| Median | 67 |
| Decile 4 | 65 |
| Decile 3 | 62 |
| Decile 2 | 59 |
| Decile 1 | 55 |
| Minimum | 33 |
|
|
- There are 135 distinct values.
- Mean = 68.5532
- Std.dev = 11.6346
- 619 items above graph maximum of 113
|
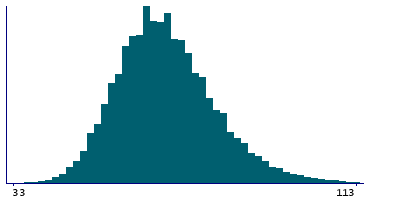
4 Instances
Instance 0 : Initial assessment visit (2006-2010) at which participants were recruited and consent given
170,565 participants, 170,565 items
| Maximum | 192 |
| Decile 9 | 84 |
| Decile 8 | 78 |
| Decile 7 | 74 |
| Decile 6 | 71 |
| Median | 68 |
| Decile 4 | 65 |
| Decile 3 | 63 |
| Decile 2 | 59 |
| Decile 1 | 55 |
| Minimum | 33 |
|
|
- There are 132 distinct values.
- Mean = 68.9936
- Std.dev = 11.5661
- 391 items above graph maximum of 113
|
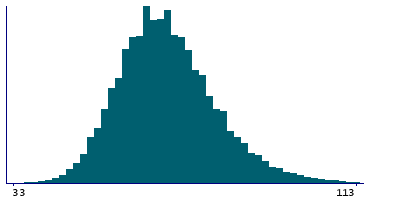
Instance 1 : First repeat assessment visit (2012-13)
20,208 participants, 20,208 items
| Maximum | 157 |
| Decile 9 | 81 |
| Decile 8 | 75 |
| Decile 7 | 71 |
| Decile 6 | 68 |
| Median | 66 |
| Decile 4 | 63 |
| Decile 3 | 61 |
| Decile 2 | 58 |
| Decile 1 | 54 |
| Minimum | 34 |
|
|
- There are 101 distinct values.
- Mean = 66.6485
- Std.dev = 10.9866
- 56 items above graph maximum of 108
|
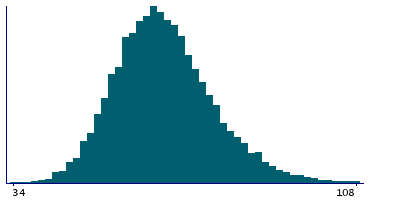
Instance 2 : Imaging visit (2014+)
84,010 participants, 84,010 items
| Maximum | 160 |
| Decile 9 | 84 |
| Decile 8 | 78 |
| Decile 7 | 74 |
| Decile 6 | 70 |
| Median | 67 |
| Decile 4 | 65 |
| Decile 3 | 62 |
| Decile 2 | 58 |
| Decile 1 | 54 |
| Minimum | 33 |
|

|
- There are 120 distinct values.
- Mean = 68.442
- Std.dev = 11.8927
- 159 items above graph maximum of 114
|
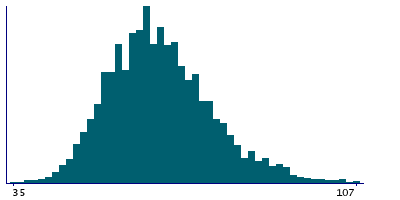
Instance 3 : First repeat imaging visit (2019+)
12,036 participants, 12,036 items
| Maximum | 156 |
| Decile 9 | 81 |
| Decile 8 | 75 |
| Decile 7 | 71 |
| Decile 6 | 68 |
| Median | 65 |
| Decile 4 | 63 |
| Decile 3 | 60 |
| Decile 2 | 57 |
| Decile 1 | 53 |
| Minimum | 35 |
|
|
- There are 86 distinct values.
- Mean = 66.2851
- Std.dev = 11.2276
- 21 items above graph maximum of 109
|


