Data
42,025 items of data are available, covering 39,697 participants.
Some values have special meanings defined by Data-Coding
100291.
Defined-instances run from 0 to 3, labelled using Instancing
2.
Units of measurement are years.
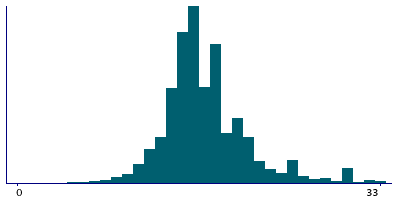
| Maximum | 71 |
| Decile 9 | 23 |
| Decile 8 | 20 |
| Decile 7 | 18 |
| Decile 6 | 18 |
| Median | 16 |
| Decile 4 | 16 |
| Decile 3 | 15 |
| Decile 2 | 15 |
| Decile 1 | 13 |
| Minimum | 5 |
|
|
- There are 65 distinct values.
- Mean = 17.9132
- Std.dev = 5.96339
- 1275 items above graph maximum of 33
- 66 items have value -3 (Prefer not to answer)
- 442 items have value -1 (Do not know)
|
4 Instances
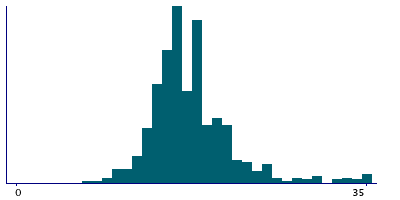
Instance 0 : Initial assessment visit (2006-2010) at which participants were recruited and consent given
39,207 participants, 39,207 items
| Maximum | 69 |
| Decile 9 | 23 |
| Decile 8 | 20 |
| Decile 7 | 18 |
| Decile 6 | 18 |
| Median | 16 |
| Decile 4 | 16 |
| Decile 3 | 15 |
| Decile 2 | 14 |
| Decile 1 | 13 |
| Minimum | 5 |
|

|
- There are 62 distinct values.
- Mean = 17.8421
- Std.dev = 5.7937
- 1115 items above graph maximum of 33
- 65 items have value -3 (Prefer not to answer)
- 414 items have value -1 (Do not know)
|
Instance 1 : First repeat assessment visit (2012-13)
647 participants, 647 items
| Maximum | 61 |
| Decile 9 | 24 |
| Decile 8 | 20 |
| Decile 7 | 19 |
| Decile 6 | 18 |
| Median | 17 |
| Decile 4 | 16 |
| Decile 3 | 15 |
| Decile 2 | 15 |
| Decile 1 | 13 |
| Minimum | 7 |
|
|
- There are 41 distinct values.
- Mean = 18.6344
- Std.dev = 7.20291
- 27 items above graph maximum of 35
- 1 items have value -3 (Prefer not to answer)
- 6 items have value -1 (Do not know)
|
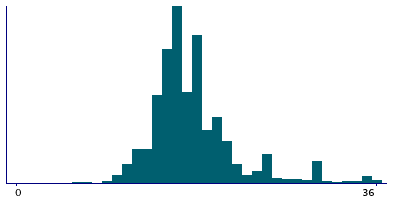
Instance 2 : Imaging visit (2014+)
1,922 participants, 1,922 items
| Maximum | 71 |
| Decile 9 | 25 |
| Decile 8 | 20 |
| Decile 7 | 19 |
| Decile 6 | 18 |
| Median | 17 |
| Decile 4 | 16 |
| Decile 3 | 15 |
| Decile 2 | 15 |
| Decile 1 | 14 |
| Minimum | 6 |
|
|
- There are 57 distinct values.
- Mean = 19.0236
- Std.dev = 8.17634
- 89 items above graph maximum of 36
- 17 items have value -1 (Do not know)
|
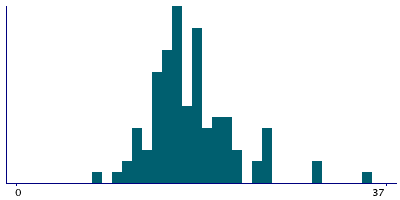
Instance 3 : First repeat imaging visit (2019+)
249 participants, 249 items
| Maximum | 55 |
| Decile 9 | 25 |
| Decile 8 | 21 |
| Decile 7 | 19 |
| Decile 6 | 18 |
| Median | 17 |
| Decile 4 | 16 |
| Decile 3 | 15 |
| Decile 2 | 14.5 |
| Decile 1 | 13.5 |
| Minimum | 8 |
|
|
- There are 30 distinct values.
- Mean = 18.6475
- Std.dev = 7.26537
- 10 items above graph maximum of 36
- 5 items have value -1 (Do not know)
|
Notes
ACE touchscreen question "How old were you when you first started smoking on most days?"
The following checks were performed:
- If answer < 5 then rejected
- If answer > Participants age then rejected
- If answer < 12 then participant asked to confirm
Field 3436 was collected from participants who indicated they currently smoke tobacco on most or all days, as defined by their answers to Field 1239
Coding 100291 defines 2 special values:
- -1 represents "Do not know"
- -3 represents "Prefer not to answer"
1 Related Data-Field
| Field ID | Description | Relationship |
|---|
| 1239 | Current tobacco smoking | Current Field was collected from participants who indicated they currently smoke tobacco on most or all days, as defined by their answers to Field 1239 |
1 Application
| Application ID | Title |
|---|
| 2482 | Comparisson of smoking behaviour between men and women to assess risk inducing habits |


