Data
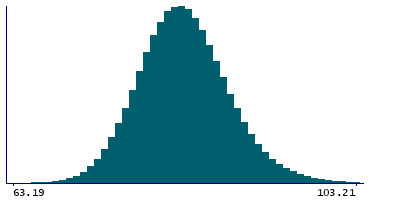
488,596 items of data are available, covering 470,511 participants.
Defined-instances run from 0 to 2, labelled using Instancing
2.
Units of measurement are femtolitres.
| Maximum | 205.2 |
| Decile 9 | 89.87 |
| Decile 8 | 87.3 |
| Decile 7 | 85.6 |
| Decile 6 | 84.15 |
| Median | 82.86 |
| Decile 4 | 81.58 |
| Decile 3 | 80.21 |
| Decile 2 | 78.7 |
| Decile 1 | 76.53 |
| Minimum | 43.31 |
|

|
- Mean = 83.0871
- Std.dev = 5.42822
- 293 items below graph minimum of 63.19
- 930 items above graph maximum of 103.21
|
3 Instances
Instance 0 : Initial assessment visit (2006-2010) at which participants were recruited and consent given
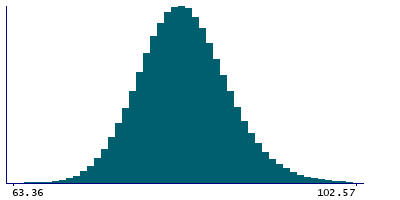
469,333 participants, 469,333 items
| Maximum | 205.2 |
| Decile 9 | 89.5 |
| Decile 8 | 87 |
| Decile 7 | 85.32 |
| Decile 6 | 83.93 |
| Median | 82.68 |
| Decile 4 | 81.4 |
| Decile 3 | 80.1 |
| Decile 2 | 78.56 |
| Decile 1 | 76.43 |
| Minimum | 43.31 |
|

|
- Mean = 82.8673
- Std.dev = 5.31549
- 305 items below graph minimum of 63.36
- 916 items above graph maximum of 102.57
|
Instance 1 : First repeat assessment visit (2012-13)
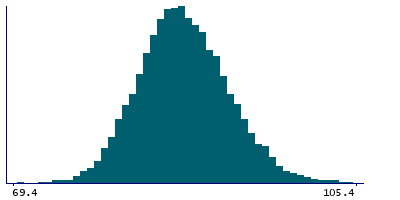
13,723 participants, 13,723 items
| Maximum | 121.75 |
| Decile 9 | 93.4 |
| Decile 8 | 91.17 |
| Decile 7 | 89.6 |
| Decile 6 | 88.29 |
| Median | 87.09 |
| Decile 4 | 85.9 |
| Decile 3 | 84.7 |
| Decile 2 | 83.395 |
| Decile 1 | 81.4 |
| Minimum | 54.1 |
|

|
- Mean = 87.308
- Std.dev = 4.82945
- 5 items below graph minimum of 69.4
- 26 items above graph maximum of 105.4
|
Instance 2 : Imaging visit (2014+)
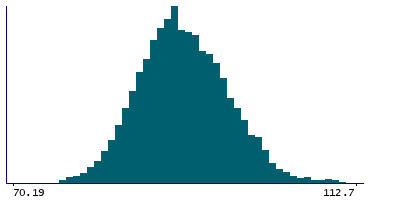
5,540 participants, 5,540 items
| Maximum | 129.99 |
| Decile 9 | 98.53 |
| Decile 8 | 95.86 |
| Decile 7 | 94.04 |
| Decile 6 | 92.42 |
| Median | 90.9 |
| Decile 4 | 89.61 |
| Decile 3 | 88.19 |
| Decile 2 | 86.54 |
| Decile 1 | 84.36 |
| Minimum | 54.16 |
|

|
- Mean = 91.2589
- Std.dev = 5.68206
- 4 items below graph minimum of 70.19
- 7 items above graph maximum of 112.7
|


