Data
70,320 items of data are available, covering 66,459 participants.
Defined-instances run from 2 to 3, labelled using Instancing
2.
Units of measurement are Z.
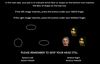
| Maximum | 13.78 |
| Decile 9 | 8.122 |
| Decile 8 | 7.262 |
| Decile 7 | 6.644 |
| Decile 6 | 6.119 |
| Median | 5.64 |
| Decile 4 | 5.169 |
| Decile 3 | 4.67 |
| Decile 2 | 4.092 |
| Decile 1 | 3.301 |
| Minimum | -4.208 |
|
|
- Mean = 5.67505
- Std.dev = 1.87978
- 5 items below graph minimum of -1.52
- 4 items above graph maximum of 12.943
|
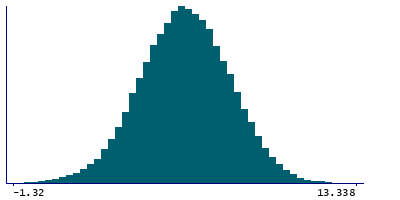
2 Instances
Instance 2 : Imaging visit (2014+)
66,036 participants, 66,036 items
| Maximum | 13.6 |
| Decile 9 | 8.098 |
| Decile 8 | 7.236 |
| Decile 7 | 6.616 |
| Decile 6 | 6.091 |
| Median | 5.614 |
| Decile 4 | 5.146 |
| Decile 3 | 4.646 |
| Decile 2 | 4.069 |
| Decile 1 | 3.287 |
| Minimum | -4.208 |
|
|
- Mean = 5.6526
- Std.dev = 1.87819
- 5 items below graph minimum of -1.524
- 3 items above graph maximum of 12.909
|
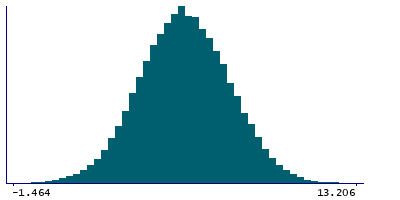
Instance 3 : First repeat imaging visit (2019+)
4,284 participants, 4,284 items
| Maximum | 13.78 |
| Decile 9 | 8.404 |
| Decile 8 | 7.6305 |
| Decile 7 | 7.0215 |
| Decile 6 | 6.5215 |
| Median | 6.043 |
| Decile 4 | 5.555 |
| Decile 3 | 5.0505 |
| Decile 2 | 4.4705 |
| Decile 1 | 3.6315 |
| Minimum | -1.055 |
|
|
- Mean = 6.0212
- Std.dev = 1.87019
- 1 item above graph maximum of 13.1765
|