Data
70,320 items of data are available, covering 66,459 participants.
Defined-instances run from 2 to 3, labelled using Instancing
2.
Units of measurement are percent.
| Maximum | 21.87 |
| Decile 9 | 2.616 |
| Decile 8 | 2.297 |
| Decile 7 | 2.088 |
| Decile 6 | 1.918 |
| Median | 1.766 |
| Decile 4 | 1.622 |
| Decile 3 | 1.472 |
| Decile 2 | 1.298 |
| Decile 1 | 1.061 |
| Minimum | -0.877 |
|

|
- Mean = 1.80976
- Std.dev = 0.647222
- 8 items below graph minimum of -0.494
- 174 items above graph maximum of 4.171
|
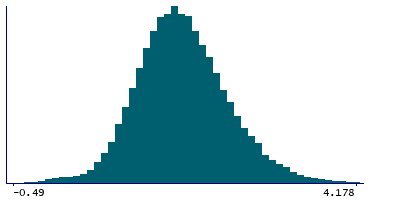
2 Instances
Instance 2 : Imaging visit (2014+)
66,036 participants, 66,036 items
| Maximum | 21.87 |
| Decile 9 | 2.627 |
| Decile 8 | 2.307 |
| Decile 7 | 2.098 |
| Decile 6 | 1.927 |
| Median | 1.774 |
| Decile 4 | 1.629 |
| Decile 3 | 1.477 |
| Decile 2 | 1.302 |
| Decile 1 | 1.063 |
| Minimum | -0.877 |
|
|
- Mean = 1.81686
- Std.dev = 0.650555
- 8 items below graph minimum of -0.501
- 162 items above graph maximum of 4.191
|
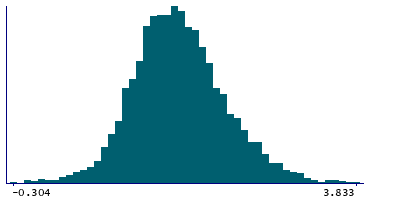
Instance 3 : First repeat imaging visit (2019+)
4,284 participants, 4,284 items
| Maximum | 9.062 |
| Decile 9 | 2.435 |
| Decile 8 | 2.138 |
| Decile 7 | 1.947 |
| Decile 6 | 1.7965 |
| Median | 1.66 |
| Decile 4 | 1.527 |
| Decile 3 | 1.39 |
| Decile 2 | 1.249 |
| Decile 1 | 1.039 |
| Minimum | -0.304 |
|
|
- Mean = 1.70031
- Std.dev = 0.582642
- 12 items above graph maximum of 3.831
|