Data
70,338 items of data are available, covering 66,477 participants.
Defined-instances run from 2 to 3, labelled using Instancing
2.
Units of measurement are AU.
| Maximum | 0.969822 |
| Decile 9 | 0.837195 |
| Decile 8 | 0.809427 |
| Decile 7 | 0.788002 |
| Decile 6 | 0.768567 |
| Median | 0.749593 |
| Decile 4 | 0.730439 |
| Decile 3 | 0.709846 |
| Decile 2 | 0.685845 |
| Decile 1 | 0.652283 |
| Minimum | 0.437604 |
|
|
- Mean = 0.746635
- Std.dev = 0.0709912
- 5 items below graph minimum of 0.467371
|
2 Instances
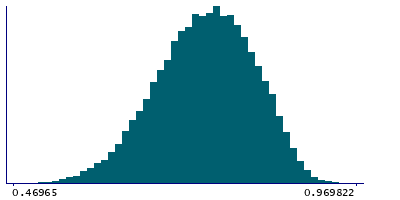
Instance 2 : Imaging visit (2014+)
66,054 participants, 66,054 items
| Maximum | 0.969822 |
| Decile 9 | 0.837002 |
| Decile 8 | 0.809141 |
| Decile 7 | 0.787559 |
| Decile 6 | 0.768122 |
| Median | 0.748939 |
| Decile 4 | 0.729824 |
| Decile 3 | 0.709294 |
| Decile 2 | 0.685264 |
| Decile 1 | 0.651738 |
| Minimum | 0.437604 |
|

|
- Mean = 0.746158
- Std.dev = 0.0711096
- 5 items below graph minimum of 0.466474
|
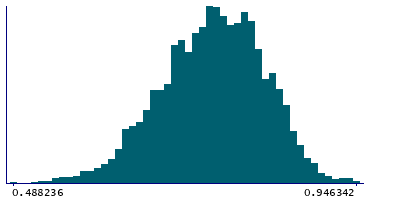
Instance 3 : First repeat imaging visit (2019+)
4,284 participants, 4,284 items
| Maximum | 0.946342 |
| Decile 9 | 0.840345 |
| Decile 8 | 0.813233 |
| Decile 7 | 0.794547 |
| Decile 6 | 0.775564 |
| Median | 0.757367 |
| Decile 4 | 0.74011 |
| Decile 3 | 0.718629 |
| Decile 2 | 0.696619 |
| Decile 1 | 0.662731 |
| Minimum | 0.488236 |
|
|
- Mean = 0.753983
- Std.dev = 0.0687234
|
Notes
Discrepancy between the (EPI-unwarped SBref) tfMRI brain image (linearly-aligned to the T1) and the T1 brain image
0 Related Data-Fields
There are no related data-fields
2 Applications
| Application ID | Title |
|---|
| 17689 | Genetic, environmental and lifestyle predictors of brain/cognitive-related outcomes. |
| 22783 | The joint analysis of imaging data and genetic data for early tumor detection, prevention, diagnosis and treatment |