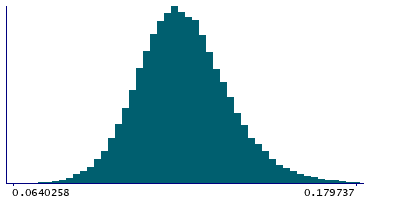
Data
83,905 items of data are available, covering 79,378 participants.
Defined-instances run from 2 to 3, labelled using Instancing
2.
Units of measurement are AU.
| Maximum | 0.231799 |
| Decile 9 | 0.140933 |
| Decile 8 | 0.133184 |
| Decile 7 | 0.128004 |
| Decile 6 | 0.1238 |
| Median | 0.119896 |
| Decile 4 | 0.116175 |
| Decile 3 | 0.112257 |
| Decile 2 | 0.107787 |
| Decile 1 | 0.101639 |
| Minimum | 0 |
|
|
- Mean = 0.120733
- Std.dev = 0.0159955
- 46 items below graph minimum of 0.0623444
- 134 items above graph maximum of 0.180227
|
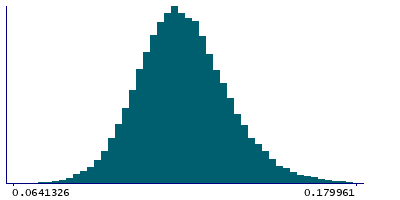
2 Instances
Instance 2 : Imaging visit (2014+)
79,147 participants, 79,147 items
| Maximum | 0.231799 |
| Decile 9 | 0.141061 |
| Decile 8 | 0.133296 |
| Decile 7 | 0.128076 |
| Decile 6 | 0.12389 |
| Median | 0.11997 |
| Decile 4 | 0.11625 |
| Decile 3 | 0.112319 |
| Decile 2 | 0.107848 |
| Decile 1 | 0.101653 |
| Minimum | 0 |
|
|
- Mean = 0.120809
- Std.dev = 0.0160255
- 43 items below graph minimum of 0.0622443
- 127 items above graph maximum of 0.18047
|
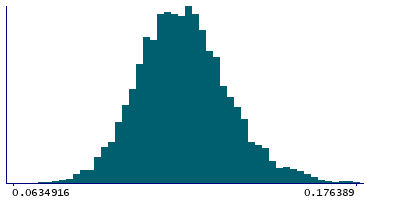
Instance 3 : First repeat imaging visit (2019+)
4,758 participants, 4,758 items
| Maximum | 0.199466 |
| Decile 9 | 0.138758 |
| Decile 8 | 0.131358 |
| Decile 7 | 0.126375 |
| Decile 6 | 0.122458 |
| Median | 0.118705 |
| Decile 4 | 0.115019 |
| Decile 3 | 0.111337 |
| Decile 2 | 0.107003 |
| Decile 1 | 0.101123 |
| Minimum | 0 |
|
|
- Mean = 0.119471
- Std.dev = 0.0154327
- 3 items below graph minimum of 0.0634885
- 9 items above graph maximum of 0.176392
|
Notes
Weighted-mean ISOVF (isotropic or free water volume fraction) in tract left corticospinal tract (from dMRI data)
0 Related Data-Fields
There are no related data-fields
2 Applications
| Application ID | Title |
|---|
| 17689 | Genetic, environmental and lifestyle predictors of brain/cognitive-related outcomes. |
| 22783 | The joint analysis of imaging data and genetic data for early tumor detection, prevention, diagnosis and treatment |

