Data
83,905 items of data are available, covering 79,378 participants.
Defined-instances run from 2 to 3, labelled using Instancing
2.
Units of measurement are AU.
| Maximum | 0.649576 |
| Decile 9 | 0.258388 |
| Decile 8 | 0.250405 |
| Decile 7 | 0.245041 |
| Decile 6 | 0.240505 |
| Median | 0.236439 |
| Decile 4 | 0.232432 |
| Decile 3 | 0.228297 |
| Decile 2 | 0.223521 |
| Decile 1 | 0.217264 |
| Minimum | 0 |
|
|
- Mean = 0.237315
- Std.dev = 0.0170437
- 13 items below graph minimum of 0.17614
- 116 items above graph maximum of 0.299512
|
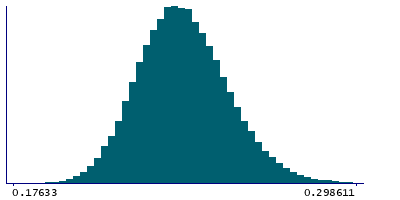
2 Instances
Instance 2 : Imaging visit (2014+)
79,147 participants, 79,147 items
| Maximum | 0.649576 |
| Decile 9 | 0.258253 |
| Decile 8 | 0.250253 |
| Decile 7 | 0.244891 |
| Decile 6 | 0.240374 |
| Median | 0.236303 |
| Decile 4 | 0.232283 |
| Decile 3 | 0.228168 |
| Decile 2 | 0.223379 |
| Decile 1 | 0.217093 |
| Minimum | 0 |
|

|
- Mean = 0.237187
- Std.dev = 0.0170768
- 12 items below graph minimum of 0.175933
- 113 items above graph maximum of 0.299413
|
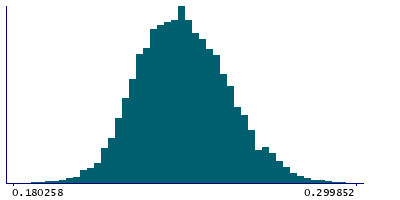
Instance 3 : First repeat imaging visit (2019+)
4,758 participants, 4,758 items
| Maximum | 0.417681 |
| Decile 9 | 0.260002 |
| Decile 8 | 0.252634 |
| Decile 7 | 0.247425 |
| Decile 6 | 0.242849 |
| Median | 0.238813 |
| Decile 4 | 0.23477 |
| Decile 3 | 0.230445 |
| Decile 2 | 0.225872 |
| Decile 1 | 0.220119 |
| Minimum | 0 |
|
|
- Mean = 0.239451
- Std.dev = 0.0163371
- 1 item below graph minimum of 0.180235
- 3 items above graph maximum of 0.299885
|
Notes
Weighted-mean OD (orientation dispersion index) in tract left uncinate fasciculus (from dMRI data)
0 Related Data-Fields
There are no related data-fields
2 Applications
| Application ID | Title |
|---|
| 17689 | Genetic, environmental and lifestyle predictors of brain/cognitive-related outcomes. |
| 22783 | The joint analysis of imaging data and genetic data for early tumor detection, prevention, diagnosis and treatment |

