Data
83,905 items of data are available, covering 79,378 participants.
Defined-instances run from 2 to 3, labelled using Instancing
2.
Units of measurement are AU.
| Maximum | 0.499194 |
| Decile 9 | 0.202092 |
| Decile 8 | 0.195278 |
| Decile 7 | 0.19065 |
| Decile 6 | 0.18673 |
| Median | 0.183133 |
| Decile 4 | 0.179641 |
| Decile 3 | 0.175893 |
| Decile 2 | 0.171566 |
| Decile 1 | 0.165691 |
| Minimum | 0 |
|

|
- Mean = 0.183688
- Std.dev = 0.0149268
- 16 items below graph minimum of 0.12929
- 119 items above graph maximum of 0.238493
|
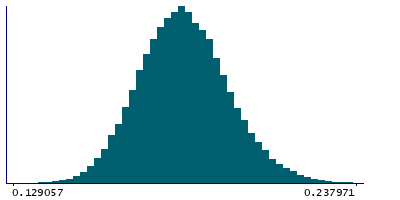
2 Instances
Instance 2 : Imaging visit (2014+)
79,147 participants, 79,147 items
| Maximum | 0.499194 |
| Decile 9 | 0.202166 |
| Decile 8 | 0.195301 |
| Decile 7 | 0.19068 |
| Decile 6 | 0.18676 |
| Median | 0.183164 |
| Decile 4 | 0.179665 |
| Decile 3 | 0.17591 |
| Decile 2 | 0.171589 |
| Decile 1 | 0.165714 |
| Minimum | 0 |
|
|
- Mean = 0.183719
- Std.dev = 0.0149142
- 13 items below graph minimum of 0.129262
- 111 items above graph maximum of 0.238618
|
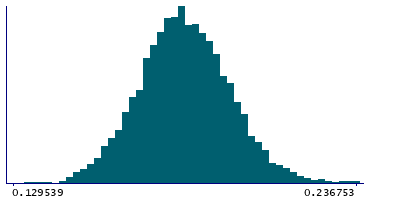
Instance 3 : First repeat imaging visit (2019+)
4,758 participants, 4,758 items
| Maximum | 0.372016 |
| Decile 9 | 0.201026 |
| Decile 8 | 0.194731 |
| Decile 7 | 0.190248 |
| Decile 6 | 0.186357 |
| Median | 0.182672 |
| Decile 4 | 0.179162 |
| Decile 3 | 0.17555 |
| Decile 2 | 0.171301 |
| Decile 1 | 0.165275 |
| Minimum | 0 |
|
|
- Mean = 0.183167
- Std.dev = 0.0151251
- 3 items below graph minimum of 0.129524
- 7 items above graph maximum of 0.236777
|
Notes
Weighted-mean OD (orientation dispersion index) in tract right medial lemniscus (from dMRI data)
0 Related Data-Fields
There are no related data-fields
2 Applications
| Application ID | Title |
|---|
| 17689 | Genetic, environmental and lifestyle predictors of brain/cognitive-related outcomes. |
| 22783 | The joint analysis of imaging data and genetic data for early tumor detection, prevention, diagnosis and treatment |

