Data
83,905 items of data are available, covering 79,378 participants.
Defined-instances run from 2 to 3, labelled using Instancing
2.
Units of measurement are AU.
| Maximum | 0.337488 |
| Decile 9 | 0.254957 |
| Decile 8 | 0.249317 |
| Decile 7 | 0.245423 |
| Decile 6 | 0.242042 |
| Median | 0.238913 |
| Decile 4 | 0.235766 |
| Decile 3 | 0.232515 |
| Decile 2 | 0.22858 |
| Decile 1 | 0.223073 |
| Minimum | 0 |
|
|
- Mean = 0.238932
- Std.dev = 0.0131756
- 38 items below graph minimum of 0.191188
- 50 items above graph maximum of 0.286842
|
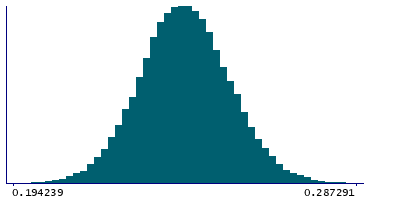
2 Instances
Instance 2 : Imaging visit (2014+)
79,147 participants, 79,147 items
| Maximum | 0.337488 |
| Decile 9 | 0.254847 |
| Decile 8 | 0.249197 |
| Decile 7 | 0.245312 |
| Decile 6 | 0.241949 |
| Median | 0.238795 |
| Decile 4 | 0.235661 |
| Decile 3 | 0.232393 |
| Decile 2 | 0.228456 |
| Decile 1 | 0.222897 |
| Minimum | 0 |
|

|
- Mean = 0.238821
- Std.dev = 0.013149
- 35 items below graph minimum of 0.190946
- 47 items above graph maximum of 0.286797
|
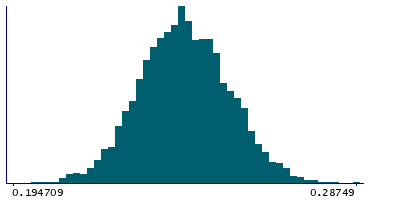
Instance 3 : First repeat imaging visit (2019+)
4,758 participants, 4,758 items
| Maximum | 0.304351 |
| Decile 9 | 0.256563 |
| Decile 8 | 0.251043 |
| Decile 7 | 0.247237 |
| Decile 6 | 0.243693 |
| Median | 0.240735 |
| Decile 4 | 0.237761 |
| Decile 3 | 0.234441 |
| Decile 2 | 0.230697 |
| Decile 1 | 0.225633 |
| Minimum | 0 |
|
|
- Mean = 0.24079
- Std.dev = 0.0134765
- 4 items below graph minimum of 0.194704
- 1 item above graph maximum of 0.287493
|
Notes
Weighted-mean OD (orientation dispersion index) in tract right anterior thalamic radiation (from dMRI data)
0 Related Data-Fields
There are no related data-fields
2 Applications
| Application ID | Title |
|---|
| 17689 | Genetic, environmental and lifestyle predictors of brain/cognitive-related outcomes. |
| 22783 | The joint analysis of imaging data and genetic data for early tumor detection, prevention, diagnosis and treatment |

