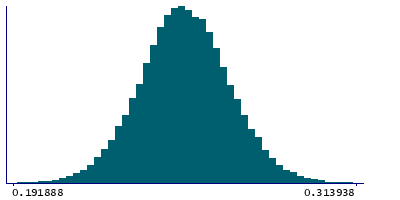
Data
83,905 items of data are available, covering 79,378 participants.
Defined-instances run from 2 to 3, labelled using Instancing
2.
Units of measurement are AU.
| Maximum | 0.409137 |
| Decile 9 | 0.272729 |
| Decile 8 | 0.26535 |
| Decile 7 | 0.260312 |
| Decile 6 | 0.255982 |
| Median | 0.251907 |
| Decile 4 | 0.247943 |
| Decile 3 | 0.243701 |
| Decile 2 | 0.238675 |
| Decile 1 | 0.231388 |
| Minimum | 0 |
|
|
- Mean = 0.251957
- Std.dev = 0.0170391
- 49 items below graph minimum of 0.190046
- 50 items above graph maximum of 0.31407
|
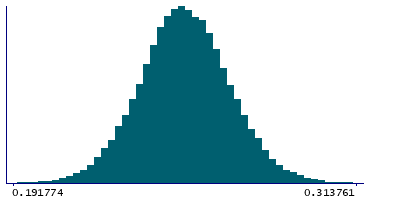
2 Instances
Instance 2 : Imaging visit (2014+)
79,147 participants, 79,147 items
| Maximum | 0.409137 |
| Decile 9 | 0.272588 |
| Decile 8 | 0.265226 |
| Decile 7 | 0.260149 |
| Decile 6 | 0.255808 |
| Median | 0.251748 |
| Decile 4 | 0.247781 |
| Decile 3 | 0.243532 |
| Decile 2 | 0.238541 |
| Decile 1 | 0.231209 |
| Minimum | 0 |
|
|
- Mean = 0.251813
- Std.dev = 0.0170206
- 46 items below graph minimum of 0.18983
- 50 items above graph maximum of 0.313967
|
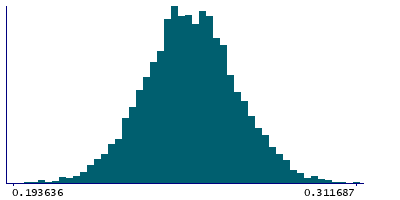
Instance 3 : First repeat imaging visit (2019+)
4,758 participants, 4,758 items
| Maximum | 0.311687 |
| Decile 9 | 0.274944 |
| Decile 8 | 0.267477 |
| Decile 7 | 0.262596 |
| Decile 6 | 0.258595 |
| Median | 0.254377 |
| Decile 4 | 0.250315 |
| Decile 3 | 0.246437 |
| Decile 2 | 0.241292 |
| Decile 1 | 0.234278 |
| Minimum | 0 |
|
|
- Mean = 0.254345
- Std.dev = 0.0171682
- 3 items below graph minimum of 0.193611
|
Notes
Weighted-mean OD (orientation dispersion index) in tract right acoustic radiation (from dMRI data)
0 Related Data-Fields
There are no related data-fields
2 Applications
| Application ID | Title |
|---|
| 17689 | Genetic, environmental and lifestyle predictors of brain/cognitive-related outcomes. |
| 22783 | The joint analysis of imaging data and genetic data for early tumor detection, prevention, diagnosis and treatment |

