Data
83,905 items of data are available, covering 79,378 participants.
Defined-instances run from 2 to 3, labelled using Instancing
2.
Units of measurement are AU.
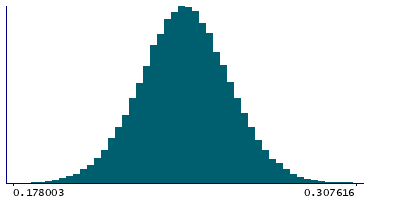
| Maximum | 0.467075 |
| Decile 9 | 0.264036 |
| Decile 8 | 0.25649 |
| Decile 7 | 0.251137 |
| Decile 6 | 0.246573 |
| Median | 0.242366 |
| Decile 4 | 0.238138 |
| Decile 3 | 0.23361 |
| Decile 2 | 0.228318 |
| Decile 1 | 0.22069 |
| Minimum | 0 |
|
|
- Mean = 0.24229
- Std.dev = 0.0176909
- 48 items below graph minimum of 0.177344
- 35 items above graph maximum of 0.307382
|
2 Instances
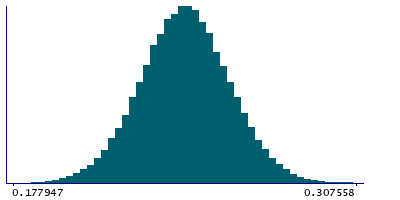
Instance 2 : Imaging visit (2014+)
79,147 participants, 79,147 items
| Maximum | 0.467075 |
| Decile 9 | 0.26396 |
| Decile 8 | 0.256416 |
| Decile 7 | 0.251075 |
| Decile 6 | 0.24651 |
| Median | 0.242301 |
| Decile 4 | 0.23807 |
| Decile 3 | 0.233531 |
| Decile 2 | 0.22821 |
| Decile 1 | 0.220622 |
| Minimum | 0 |
|
|
- Mean = 0.242222
- Std.dev = 0.0176669
- 43 items below graph minimum of 0.177284
- 33 items above graph maximum of 0.307298
|
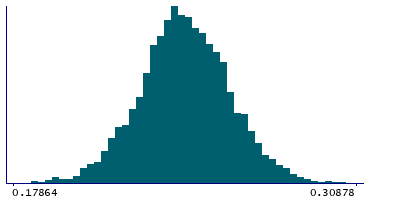
Instance 3 : First repeat imaging visit (2019+)
4,758 participants, 4,758 items
| Maximum | 0.310955 |
| Decile 9 | 0.265386 |
| Decile 8 | 0.257529 |
| Decile 7 | 0.252346 |
| Decile 6 | 0.247676 |
| Median | 0.243273 |
| Decile 4 | 0.239267 |
| Decile 3 | 0.235007 |
| Decile 2 | 0.230085 |
| Decile 1 | 0.222017 |
| Minimum | 0 |
|
|
- Mean = 0.243424
- Std.dev = 0.0180481
- 5 items below graph minimum of 0.178648
- 2 items above graph maximum of 0.308756
|
Notes
Weighted-mean OD (orientation dispersion index) in tract left acoustic radiation (from dMRI data)
0 Related Data-Fields
There are no related data-fields
2 Applications
| Application ID | Title |
|---|
| 17689 | Genetic, environmental and lifestyle predictors of brain/cognitive-related outcomes. |
| 22783 | The joint analysis of imaging data and genetic data for early tumor detection, prevention, diagnosis and treatment |

