Data
83,905 items of data are available, covering 79,378 participants.
Defined-instances run from 2 to 3, labelled using Instancing
2.
Units of measurement are AU.
| Maximum | 0.989915 |
| Decile 9 | 0.502667 |
| Decile 8 | 0.490532 |
| Decile 7 | 0.481954 |
| Decile 6 | 0.474615 |
| Median | 0.467722 |
| Decile 4 | 0.460844 |
| Decile 3 | 0.453507 |
| Decile 2 | 0.444788 |
| Decile 1 | 0.43249 |
| Minimum | 0 |
|
|
- Mean = 0.467645
- Std.dev = 0.0292152
- 54 items below graph minimum of 0.362314
- 45 items above graph maximum of 0.572844
|
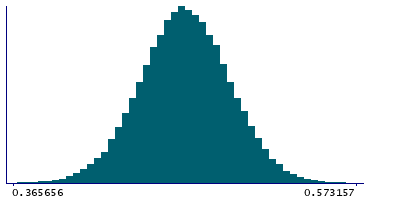
2 Instances
Instance 2 : Imaging visit (2014+)
79,147 participants, 79,147 items
| Maximum | 0.989915 |
| Decile 9 | 0.502339 |
| Decile 8 | 0.490282 |
| Decile 7 | 0.481667 |
| Decile 6 | 0.474309 |
| Median | 0.467412 |
| Decile 4 | 0.460538 |
| Decile 3 | 0.453203 |
| Decile 2 | 0.444419 |
| Decile 1 | 0.432153 |
| Minimum | 0 |
|

|
- Mean = 0.467322
- Std.dev = 0.0292667
- 52 items below graph minimum of 0.361967
- 41 items above graph maximum of 0.572525
|
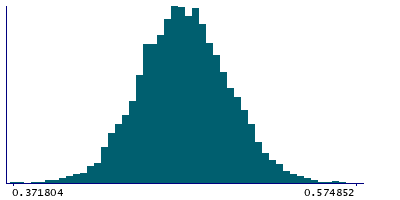
Instance 3 : First repeat imaging visit (2019+)
4,758 participants, 4,758 items
| Maximum | 0.912288 |
| Decile 9 | 0.507147 |
| Decile 8 | 0.495051 |
| Decile 7 | 0.4862 |
| Decile 6 | 0.479249 |
| Median | 0.472228 |
| Decile 4 | 0.465957 |
| Decile 3 | 0.458809 |
| Decile 2 | 0.450866 |
| Decile 1 | 0.439406 |
| Minimum | 0.371804 |
|
|
- Mean = 0.47301
- Std.dev = 0.0278006
- 4 items above graph maximum of 0.574887
|
Notes
Weighted-mean ICVF (intra-cellular volume fraction) in tract right uncinate fasciculus (from dMRI data)
0 Related Data-Fields
There are no related data-fields
2 Applications
| Application ID | Title |
|---|
| 17689 | Genetic, environmental and lifestyle predictors of brain/cognitive-related outcomes. |
| 22783 | The joint analysis of imaging data and genetic data for early tumor detection, prevention, diagnosis and treatment |

