Data
83,905 items of data are available, covering 79,378 participants.
Defined-instances run from 2 to 3, labelled using Instancing
2.
Units of measurement are AU.
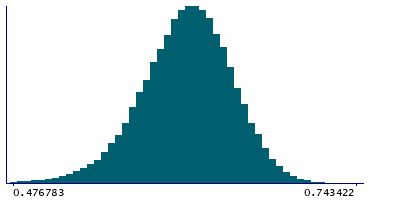
| Maximum | 0.989442 |
| Decile 9 | 0.65362 |
| Decile 8 | 0.63943 |
| Decile 7 | 0.62894 |
| Decile 6 | 0.619894 |
| Median | 0.611195 |
| Decile 4 | 0.602357 |
| Decile 3 | 0.592367 |
| Decile 2 | 0.580121 |
| Decile 1 | 0.562355 |
| Minimum | 0 |
|
|
- Mean = 0.608954
- Std.dev = 0.0378641
- 248 items below graph minimum of 0.47109
- 33 items above graph maximum of 0.744886
|
2 Instances
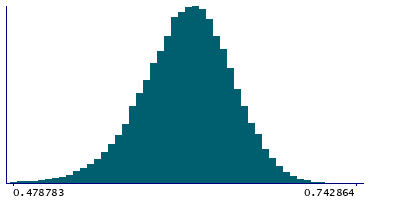
Instance 2 : Imaging visit (2014+)
79,147 participants, 79,147 items
| Maximum | 0.989442 |
| Decile 9 | 0.653508 |
| Decile 8 | 0.639287 |
| Decile 7 | 0.628688 |
| Decile 6 | 0.619683 |
| Median | 0.610987 |
| Decile 4 | 0.602031 |
| Decile 3 | 0.592013 |
| Decile 2 | 0.579802 |
| Decile 1 | 0.561811 |
| Minimum | 0 |
|
|
- Mean = 0.608667
- Std.dev = 0.038011
- 233 items below graph minimum of 0.470113
- 30 items above graph maximum of 0.745206
|
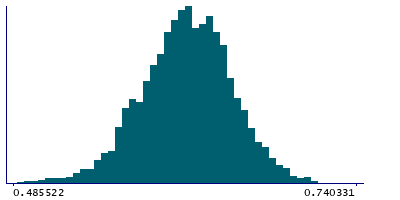
Instance 3 : First repeat imaging visit (2019+)
4,758 participants, 4,758 items
| Maximum | 0.909821 |
| Decile 9 | 0.655401 |
| Decile 8 | 0.641264 |
| Decile 7 | 0.632084 |
| Decile 6 | 0.623509 |
| Median | 0.614839 |
| Decile 4 | 0.606686 |
| Decile 3 | 0.597868 |
| Decile 2 | 0.586259 |
| Decile 1 | 0.570448 |
| Minimum | 0.403504 |
|
|
- Mean = 0.613733
- Std.dev = 0.0349867
- 12 items below graph minimum of 0.485496
- 3 items above graph maximum of 0.740353
|
Notes
Weighted-mean ICVF (intra-cellular volume fraction) in tract right superior longitudinal fasciculus (from dMRI data)
0 Related Data-Fields
There are no related data-fields
2 Applications
| Application ID | Title |
|---|
| 17689 | Genetic, environmental and lifestyle predictors of brain/cognitive-related outcomes. |
| 22783 | The joint analysis of imaging data and genetic data for early tumor detection, prevention, diagnosis and treatment |

