Data
83,905 items of data are available, covering 79,378 participants.
Defined-instances run from 2 to 3, labelled using Instancing
2.
Units of measurement are AU.
| Maximum | 0.989792 |
| Decile 9 | 0.662094 |
| Decile 8 | 0.647984 |
| Decile 7 | 0.637591 |
| Decile 6 | 0.628215 |
| Median | 0.619538 |
| Decile 4 | 0.610392 |
| Decile 3 | 0.600284 |
| Decile 2 | 0.587862 |
| Decile 1 | 0.569601 |
| Minimum | 0 |
|

|
- Mean = 0.617051
- Std.dev = 0.0383617
- 231 items below graph minimum of 0.477109
- 33 items above graph maximum of 0.754587
|
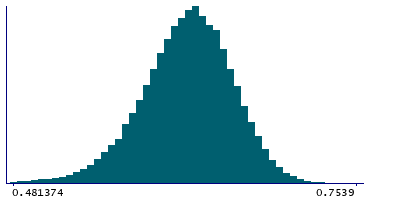
2 Instances
Instance 2 : Imaging visit (2014+)
79,147 participants, 79,147 items
| Maximum | 0.989792 |
| Decile 9 | 0.661974 |
| Decile 8 | 0.647826 |
| Decile 7 | 0.637365 |
| Decile 6 | 0.627986 |
| Median | 0.619284 |
| Decile 4 | 0.610107 |
| Decile 3 | 0.599934 |
| Decile 2 | 0.587459 |
| Decile 1 | 0.569133 |
| Minimum | 0 |
|
|
- Mean = 0.616751
- Std.dev = 0.0385144
- 217 items below graph minimum of 0.476292
- 30 items above graph maximum of 0.754815
|
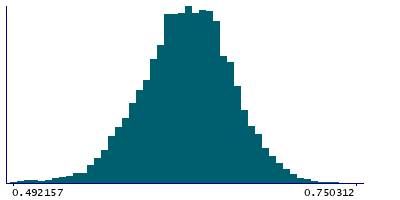
Instance 3 : First repeat imaging visit (2019+)
4,758 participants, 4,758 items
| Maximum | 0.928047 |
| Decile 9 | 0.664232 |
| Decile 8 | 0.650468 |
| Decile 7 | 0.640823 |
| Decile 6 | 0.632106 |
| Median | 0.623555 |
| Decile 4 | 0.614636 |
| Decile 3 | 0.606125 |
| Decile 2 | 0.594634 |
| Decile 1 | 0.578193 |
| Minimum | 0.426604 |
|
|
- Mean = 0.622047
- Std.dev = 0.0353524
- 13 items below graph minimum of 0.492155
- 3 items above graph maximum of 0.75027
|
Notes
Weighted-mean ICVF (intra-cellular volume fraction) in tract left superior longitudinal fasciculus (from dMRI data)
0 Related Data-Fields
There are no related data-fields
2 Applications
| Application ID | Title |
|---|
| 17689 | Genetic, environmental and lifestyle predictors of brain/cognitive-related outcomes. |
| 22783 | The joint analysis of imaging data and genetic data for early tumor detection, prevention, diagnosis and treatment |

