Data
83,905 items of data are available, covering 79,378 participants.
Defined-instances run from 2 to 3, labelled using Instancing
2.
Units of measurement are AU.
| Maximum | 0.989533 |
| Decile 9 | 0.557198 |
| Decile 8 | 0.543748 |
| Decile 7 | 0.534386 |
| Decile 6 | 0.525845 |
| Median | 0.518114 |
| Decile 4 | 0.509952 |
| Decile 3 | 0.501005 |
| Decile 2 | 0.490251 |
| Decile 1 | 0.474843 |
| Minimum | 0 |
|
|
- Mean = 0.516729
- Std.dev = 0.0339866
- 100 items below graph minimum of 0.392489
- 28 items above graph maximum of 0.639553
|
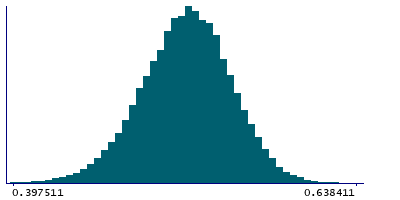
2 Instances
Instance 2 : Imaging visit (2014+)
79,147 participants, 79,147 items
| Maximum | 0.989533 |
| Decile 9 | 0.55704 |
| Decile 8 | 0.543585 |
| Decile 7 | 0.534194 |
| Decile 6 | 0.52558 |
| Median | 0.517848 |
| Decile 4 | 0.509663 |
| Decile 3 | 0.500655 |
| Decile 2 | 0.489918 |
| Decile 1 | 0.474438 |
| Minimum | 0 |
|

|
- Mean = 0.516442
- Std.dev = 0.0341067
- 95 items below graph minimum of 0.391836
- 26 items above graph maximum of 0.639641
|
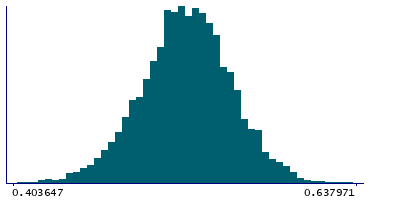
Instance 3 : First repeat imaging visit (2019+)
4,758 participants, 4,758 items
| Maximum | 0.880317 |
| Decile 9 | 0.559943 |
| Decile 8 | 0.546869 |
| Decile 7 | 0.537836 |
| Decile 6 | 0.529927 |
| Median | 0.521785 |
| Decile 4 | 0.514358 |
| Decile 3 | 0.506801 |
| Decile 2 | 0.496628 |
| Decile 1 | 0.481744 |
| Minimum | 0.385819 |
|
|
- Mean = 0.521514
- Std.dev = 0.03154
- 4 items below graph minimum of 0.403546
- 2 items above graph maximum of 0.638141
|
Notes
Weighted-mean ICVF (intra-cellular volume fraction) in tract left inferior longitudinal fasciculus (from dMRI data)
0 Related Data-Fields
There are no related data-fields
2 Applications
| Application ID | Title |
|---|
| 17689 | Genetic, environmental and lifestyle predictors of brain/cognitive-related outcomes. |
| 22783 | The joint analysis of imaging data and genetic data for early tumor detection, prevention, diagnosis and treatment |

