Data
83,905 items of data are available, covering 79,378 participants.
Defined-instances run from 2 to 3, labelled using Instancing
2.
Units of measurement are AU.
| Maximum | 0.989374 |
| Decile 9 | 0.709184 |
| Decile 8 | 0.699359 |
| Decile 7 | 0.692177 |
| Decile 6 | 0.685902 |
| Median | 0.680052 |
| Decile 4 | 0.673992 |
| Decile 3 | 0.667386 |
| Decile 2 | 0.659413 |
| Decile 1 | 0.647567 |
| Minimum | 0 |
|
|
- Mean = 0.678733
- Std.dev = 0.0280905
- 194 items below graph minimum of 0.585951
- 33 items above graph maximum of 0.770801
|
2 Instances
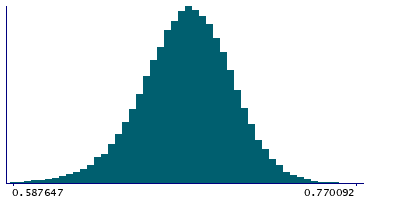
Instance 2 : Imaging visit (2014+)
79,147 participants, 79,147 items
| Maximum | 0.989374 |
| Decile 9 | 0.709249 |
| Decile 8 | 0.699383 |
| Decile 7 | 0.692178 |
| Decile 6 | 0.685886 |
| Median | 0.680011 |
| Decile 4 | 0.673944 |
| Decile 3 | 0.667297 |
| Decile 2 | 0.659314 |
| Decile 1 | 0.647455 |
| Minimum | 0 |
|

|
- Mean = 0.678696
- Std.dev = 0.028025
- 186 items below graph minimum of 0.585662
- 32 items above graph maximum of 0.771042
|
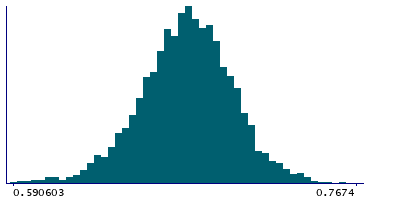
Instance 3 : First repeat imaging visit (2019+)
4,758 participants, 4,758 items
| Maximum | 0.784481 |
| Decile 9 | 0.708478 |
| Decile 8 | 0.699003 |
| Decile 7 | 0.692177 |
| Decile 6 | 0.686129 |
| Median | 0.680569 |
| Decile 4 | 0.675094 |
| Decile 3 | 0.668588 |
| Decile 2 | 0.660943 |
| Decile 1 | 0.64953 |
| Minimum | 0 |
|
|
- Mean = 0.679336
- Std.dev = 0.0291524
- 6 items below graph minimum of 0.590582
- 1 item above graph maximum of 0.767427
|
Notes
Weighted-mean ICVF (intra-cellular volume fraction) in tract right corticospinal tract (from dMRI data)
0 Related Data-Fields
There are no related data-fields
2 Applications
| Application ID | Title |
|---|
| 17689 | Genetic, environmental and lifestyle predictors of brain/cognitive-related outcomes. |
| 22783 | The joint analysis of imaging data and genetic data for early tumor detection, prevention, diagnosis and treatment |

