Data
83,905 items of data are available, covering 79,378 participants.
Defined-instances run from 2 to 3, labelled using Instancing
2.
Units of measurement are AU.
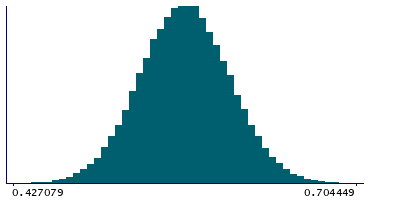
| Maximum | 0.99 |
| Decile 9 | 0.61055 |
| Decile 8 | 0.594404 |
| Decile 7 | 0.582667 |
| Decile 6 | 0.572741 |
| Median | 0.563357 |
| Decile 4 | 0.554079 |
| Decile 3 | 0.54406 |
| Decile 2 | 0.532458 |
| Decile 1 | 0.51658 |
| Minimum | 0 |
|
|
- Mean = 0.563384
- Std.dev = 0.0385231
- 34 items below graph minimum of 0.42261
- 27 items above graph maximum of 0.70452
|
2 Instances
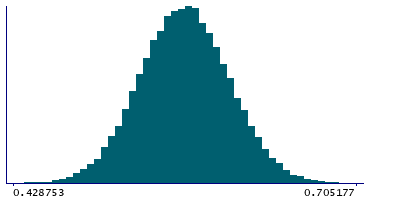
Instance 2 : Imaging visit (2014+)
79,147 participants, 79,147 items
| Maximum | 0.99 |
| Decile 9 | 0.610403 |
| Decile 8 | 0.594236 |
| Decile 7 | 0.582421 |
| Decile 6 | 0.572495 |
| Median | 0.563078 |
| Decile 4 | 0.55376 |
| Decile 3 | 0.543752 |
| Decile 2 | 0.53212 |
| Decile 1 | 0.516264 |
| Minimum | 0 |
|
|
- Mean = 0.563131
- Std.dev = 0.0385259
- 31 items below graph minimum of 0.422124
- 27 items above graph maximum of 0.704543
|
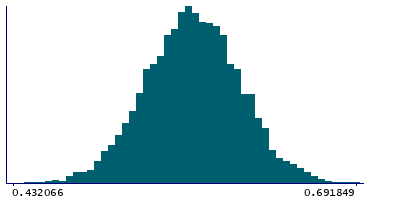
Instance 3 : First repeat imaging visit (2019+)
4,758 participants, 4,758 items
| Maximum | 0.691849 |
| Decile 9 | 0.613026 |
| Decile 8 | 0.597875 |
| Decile 7 | 0.586918 |
| Decile 6 | 0.57738 |
| Median | 0.567902 |
| Decile 4 | 0.559033 |
| Decile 3 | 0.549214 |
| Decile 2 | 0.53754 |
| Decile 1 | 0.522451 |
| Minimum | 0 |
|
|
- Mean = 0.567599
- Std.dev = 0.0382306
- 3 items below graph minimum of 0.431877
|
Notes
Weighted-mean ICVF (intra-cellular volume fraction) in tract left cingulate gyrus part of cingulum (from dMRI data)
0 Related Data-Fields
There are no related data-fields
2 Applications
| Application ID | Title |
|---|
| 17689 | Genetic, environmental and lifestyle predictors of brain/cognitive-related outcomes. |
| 22783 | The joint analysis of imaging data and genetic data for early tumor detection, prevention, diagnosis and treatment |

