Data
83,905 items of data are available, covering 79,378 participants.
Defined-instances run from 2 to 3, labelled using Instancing
2.
Units of measurement are AU.
| Maximum | 0.989796 |
| Decile 9 | 0.573801 |
| Decile 8 | 0.56088 |
| Decile 7 | 0.551548 |
| Decile 6 | 0.543432 |
| Median | 0.535642 |
| Decile 4 | 0.527656 |
| Decile 3 | 0.518847 |
| Decile 2 | 0.508217 |
| Decile 1 | 0.492497 |
| Minimum | 0 |
|
|
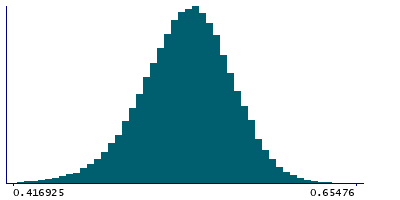
- Mean = 0.533984
- Std.dev = 0.0341541
- 119 items below graph minimum of 0.411193
- 34 items above graph maximum of 0.655106
|
2 Instances
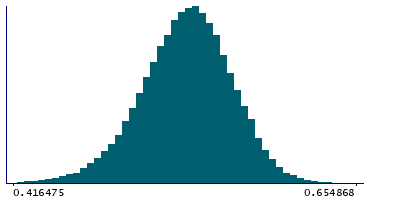
Instance 2 : Imaging visit (2014+)
79,147 participants, 79,147 items
| Maximum | 0.989796 |
| Decile 9 | 0.573657 |
| Decile 8 | 0.560668 |
| Decile 7 | 0.551326 |
| Decile 6 | 0.54316 |
| Median | 0.535328 |
| Decile 4 | 0.527305 |
| Decile 3 | 0.518466 |
| Decile 2 | 0.507839 |
| Decile 1 | 0.492035 |
| Minimum | 0 |
|
|
- Mean = 0.533689
- Std.dev = 0.0342053
- 111 items below graph minimum of 0.410413
- 33 items above graph maximum of 0.655279
|
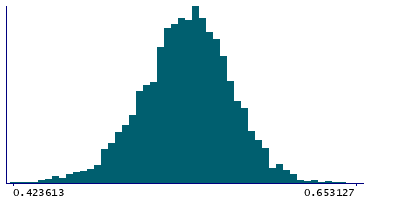
Instance 3 : First repeat imaging visit (2019+)
4,758 participants, 4,758 items
| Maximum | 0.986521 |
| Decile 9 | 0.57663 |
| Decile 8 | 0.563838 |
| Decile 7 | 0.555147 |
| Decile 6 | 0.547532 |
| Median | 0.540446 |
| Decile 4 | 0.532847 |
| Decile 3 | 0.524889 |
| Decile 2 | 0.514818 |
| Decile 1 | 0.500107 |
| Minimum | 0 |
|
|
- Mean = 0.538887
- Std.dev = 0.0329067
- 8 items below graph minimum of 0.423583
- 1 item above graph maximum of 0.653153
|
Notes
Weighted-mean ICVF (intra-cellular volume fraction) in tract left anterior thalamic radiation (from dMRI data)
0 Related Data-Fields
There are no related data-fields
2 Applications
| Application ID | Title |
|---|
| 17689 | Genetic, environmental and lifestyle predictors of brain/cognitive-related outcomes. |
| 22783 | The joint analysis of imaging data and genetic data for early tumor detection, prevention, diagnosis and treatment |

