Data
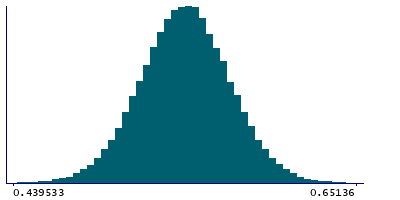
83,905 items of data are available, covering 79,378 participants.
Defined-instances run from 2 to 3, labelled using Instancing
2.
Units of measurement are AU.
| Maximum | 0.989284 |
| Decile 9 | 0.57979 |
| Decile 8 | 0.567524 |
| Decile 7 | 0.558725 |
| Decile 6 | 0.551319 |
| Median | 0.544355 |
| Decile 4 | 0.537395 |
| Decile 3 | 0.529931 |
| Decile 2 | 0.521099 |
| Decile 1 | 0.508673 |
| Minimum | 0 |
|

|
- Mean = 0.544099
- Std.dev = 0.0305121
- 86 items below graph minimum of 0.437556
- 40 items above graph maximum of 0.650907
|
2 Instances
Instance 2 : Imaging visit (2014+)
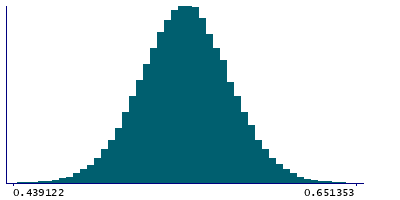
79,147 participants, 79,147 items
| Maximum | 0.989284 |
| Decile 9 | 0.57961 |
| Decile 8 | 0.567315 |
| Decile 7 | 0.558485 |
| Decile 6 | 0.551103 |
| Median | 0.544123 |
| Decile 4 | 0.537161 |
| Decile 3 | 0.529708 |
| Decile 2 | 0.52082 |
| Decile 1 | 0.508353 |
| Minimum | 0 |
|

|
- Mean = 0.543876
- Std.dev = 0.0304945
- 81 items below graph minimum of 0.437096
- 40 items above graph maximum of 0.650867
|
Instance 3 : First repeat imaging visit (2019+)
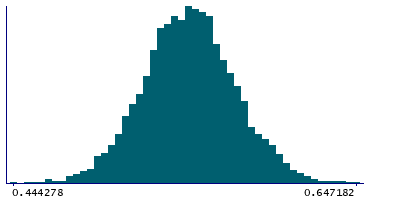
4,758 participants, 4,758 items
| Maximum | 0.647182 |
| Decile 9 | 0.582512 |
| Decile 8 | 0.57055 |
| Decile 7 | 0.561657 |
| Decile 6 | 0.554787 |
| Median | 0.548032 |
| Decile 4 | 0.541062 |
| Decile 3 | 0.53389 |
| Decile 2 | 0.525851 |
| Decile 1 | 0.513382 |
| Minimum | 0 |
|

|
- Mean = 0.547809
- Std.dev = 0.0305653
- 4 items below graph minimum of 0.444251
|
Notes
Weighted-mean ICVF (intra-cellular volume fraction) in tract right acoustic radiation (from dMRI data)
0 Related Data-Fields
There are no related data-fields
2 Applications
| Application ID | Title |
|---|
| 17689 | Genetic, environmental and lifestyle predictors of brain/cognitive-related outcomes. |
| 22783 | The joint analysis of imaging data and genetic data for early tumor detection, prevention, diagnosis and treatment |


