Data
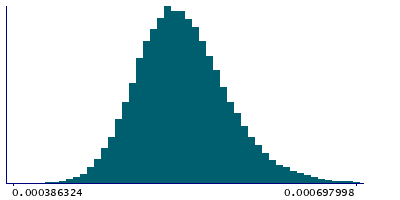
83,909 items of data are available, covering 79,382 participants.
Defined-instances run from 2 to 3, labelled using Instancing
2.
Units of measurement are AU.
| Maximum | 0.00173507 |
| Decile 9 | 0.000596587 |
| Decile 8 | 0.000575077 |
| Decile 7 | 0.000560861 |
| Decile 6 | 0.000549308 |
| Median | 0.000538809 |
| Decile 4 | 0.000528669 |
| Decile 3 | 0.000518545 |
| Decile 2 | 0.000506907 |
| Decile 1 | 0.000491478 |
| Minimum | 0 |
|

|
- Mean = 0.000542278
- Std.dev = 4.44322e-05
- 11 items below graph minimum of 0.000386368
- 235 items above graph maximum of 0.000701696
|
2 Instances
Instance 2 : Imaging visit (2014+)
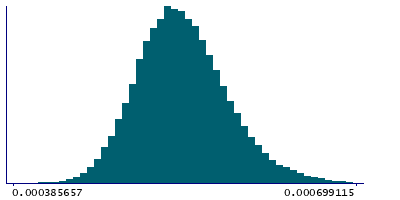
79,151 participants, 79,151 items
| Maximum | 0.00173507 |
| Decile 9 | 0.000597211 |
| Decile 8 | 0.000575582 |
| Decile 7 | 0.000561274 |
| Decile 6 | 0.000549736 |
| Median | 0.000539145 |
| Decile 4 | 0.000529036 |
| Decile 3 | 0.00051881 |
| Decile 2 | 0.000507076 |
| Decile 1 | 0.000491548 |
| Minimum | 0 |
|

|
- Mean = 0.000542614
- Std.dev = 4.4614e-05
- 10 items below graph minimum of 0.000385885
- 216 items above graph maximum of 0.000702875
|
Instance 3 : First repeat imaging visit (2019+)
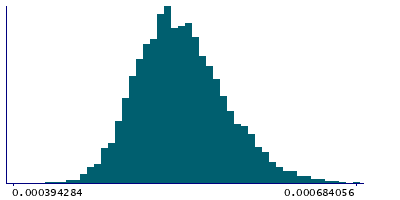
4,758 participants, 4,758 items
| Maximum | 0.00133319 |
| Decile 9 | 0.000587502 |
| Decile 8 | 0.000566906 |
| Decile 7 | 0.00055353 |
| Decile 6 | 0.000543193 |
| Median | 0.000533646 |
| Decile 4 | 0.000523937 |
| Decile 3 | 0.000515213 |
| Decile 2 | 0.000504391 |
| Decile 1 | 0.000490874 |
| Minimum | 0 |
|

|
- Mean = 0.000536694
- Std.dev = 4.08891e-05
- 1 item below graph minimum of 0.000394246
- 11 items above graph maximum of 0.00068413
|
Notes
Weighted-mean L3 in tract left uncinate fasciculus (from dMRI data)
0 Related Data-Fields
There are no related data-fields
2 Applications
| Application ID | Title |
|---|
| 17689 | Genetic, environmental and lifestyle predictors of brain/cognitive-related outcomes. |
| 22783 | The joint analysis of imaging data and genetic data for early tumor detection, prevention, diagnosis and treatment |


