Data
83,909 items of data are available, covering 79,382 participants.
Defined-instances run from 2 to 3, labelled using Instancing
2.
Units of measurement are AU.
| Maximum | 0.00118887 |
| Decile 9 | 0.000569815 |
| Decile 8 | 0.000542756 |
| Decile 7 | 0.000526803 |
| Decile 6 | 0.000514543 |
| Median | 0.000503979 |
| Decile 4 | 0.000494209 |
| Decile 3 | 0.000484442 |
| Decile 2 | 0.000473549 |
| Decile 1 | 0.000459713 |
| Minimum | 0 |
|

|
- Mean = 0.000510958
- Std.dev = 4.85573e-05
- 23 items below graph minimum of 0.00034961
- 620 items above graph maximum of 0.000679918
|
2 Instances
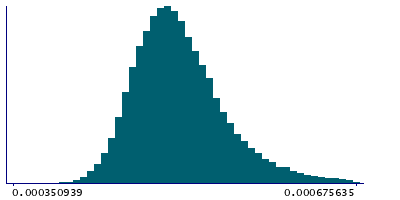
Instance 2 : Imaging visit (2014+)
79,151 participants, 79,151 items
| Maximum | 0.00118887 |
| Decile 9 | 0.000570673 |
| Decile 8 | 0.000543541 |
| Decile 7 | 0.000527508 |
| Decile 6 | 0.000515152 |
| Median | 0.00050457 |
| Decile 4 | 0.000494832 |
| Decile 3 | 0.000484924 |
| Decile 2 | 0.000473988 |
| Decile 1 | 0.00046011 |
| Minimum | 0 |
|
|
- Mean = 0.000511581
- Std.dev = 4.87061e-05
- 20 items below graph minimum of 0.000349547
- 587 items above graph maximum of 0.000681236
|
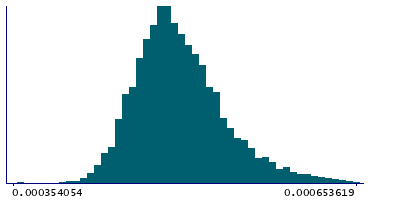
Instance 3 : First repeat imaging visit (2019+)
4,758 participants, 4,758 items
| Maximum | 0.00101225 |
| Decile 9 | 0.000553764 |
| Decile 8 | 0.000529728 |
| Decile 7 | 0.000515631 |
| Decile 6 | 0.000504576 |
| Median | 0.000494634 |
| Decile 4 | 0.000486107 |
| Decile 3 | 0.000477396 |
| Decile 2 | 0.000467572 |
| Decile 1 | 0.000453909 |
| Minimum | 0 |
|
|
- Mean = 0.000500594
- Std.dev = 4.47574e-05
- 3 items below graph minimum of 0.000354053
- 30 items above graph maximum of 0.00065362
|
Notes
Weighted-mean L3 in tract right posterior thalamic radiation (from dMRI data)
0 Related Data-Fields
There are no related data-fields
2 Applications
| Application ID | Title |
|---|
| 17689 | Genetic, environmental and lifestyle predictors of brain/cognitive-related outcomes. |
| 22783 | The joint analysis of imaging data and genetic data for early tumor detection, prevention, diagnosis and treatment |

