Data
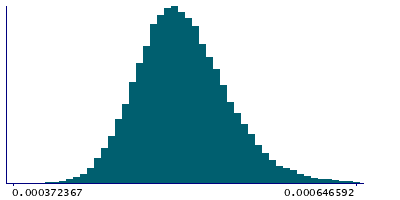
83,909 items of data are available, covering 79,382 participants.
Defined-instances run from 2 to 3, labelled using Instancing
2.
Units of measurement are AU.
| Maximum | 0.00100473 |
| Decile 9 | 0.000556416 |
| Decile 8 | 0.000537592 |
| Decile 7 | 0.000524943 |
| Decile 6 | 0.000514736 |
| Median | 0.000505382 |
| Decile 4 | 0.00049663 |
| Decile 3 | 0.000487572 |
| Decile 2 | 0.000477328 |
| Decile 1 | 0.000463536 |
| Minimum | 0 |
|

|
- Mean = 0.000508218
- Std.dev = 3.82352e-05
- 20 items below graph minimum of 0.000370656
- 168 items above graph maximum of 0.000649295
|
2 Instances
Instance 2 : Imaging visit (2014+)
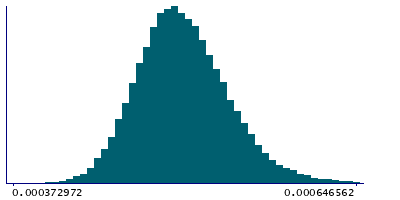
79,151 participants, 79,151 items
| Maximum | 0.00100473 |
| Decile 9 | 0.000556751 |
| Decile 8 | 0.000537863 |
| Decile 7 | 0.000525184 |
| Decile 6 | 0.000514919 |
| Median | 0.00050554 |
| Decile 4 | 0.000496795 |
| Decile 3 | 0.000487676 |
| Decile 2 | 0.000477378 |
| Decile 1 | 0.000463551 |
| Minimum | 0 |
|

|
- Mean = 0.000508409
- Std.dev = 3.83798e-05
- 19 items below graph minimum of 0.000370352
- 159 items above graph maximum of 0.000649951
|
Instance 3 : First repeat imaging visit (2019+)
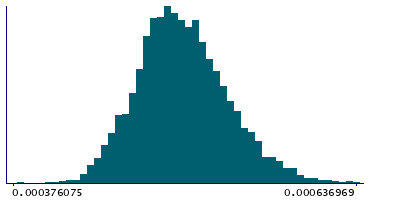
4,758 participants, 4,758 items
| Maximum | 0.000772595 |
| Decile 9 | 0.000550089 |
| Decile 8 | 0.000532815 |
| Decile 7 | 0.000520678 |
| Decile 6 | 0.000511665 |
| Median | 0.000502395 |
| Decile 4 | 0.000493948 |
| Decile 3 | 0.000485382 |
| Decile 2 | 0.000476702 |
| Decile 1 | 0.000463033 |
| Minimum | 0 |
|

|
- Mean = 0.000505039
- Std.dev = 3.5594e-05
- 1 item below graph minimum of 0.000375977
- 9 items above graph maximum of 0.000637145
|
Notes
Weighted-mean L3 in tract forceps minor (from dMRI data)
0 Related Data-Fields
There are no related data-fields
2 Applications
| Application ID | Title |
|---|
| 17689 | Genetic, environmental and lifestyle predictors of brain/cognitive-related outcomes. |
| 22783 | The joint analysis of imaging data and genetic data for early tumor detection, prevention, diagnosis and treatment |


