Data
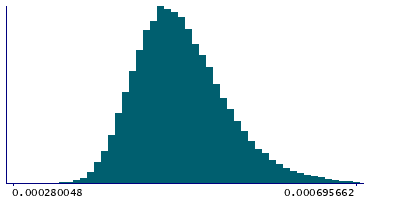
83,909 items of data are available, covering 79,382 participants.
Defined-instances run from 2 to 3, labelled using Instancing
2.
Units of measurement are AU.
| Maximum | 0.0011566 |
| Decile 9 | 0.000558804 |
| Decile 8 | 0.000528186 |
| Decile 7 | 0.000508366 |
| Decile 6 | 0.000492386 |
| Median | 0.000478466 |
| Decile 4 | 0.000465524 |
| Decile 3 | 0.000452567 |
| Decile 2 | 0.000437982 |
| Decile 1 | 0.000419363 |
| Minimum | 0 |
|

|
- Mean = 0.000485081
- Std.dev = 5.71588e-05
- 19 items below graph minimum of 0.000279922
- 247 items above graph maximum of 0.000698245
|
2 Instances
Instance 2 : Imaging visit (2014+)
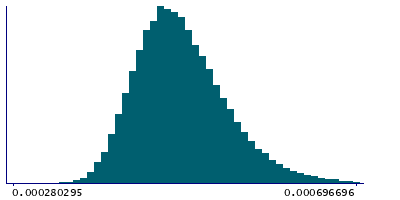
79,151 participants, 79,151 items
| Maximum | 0.0011566 |
| Decile 9 | 0.000559503 |
| Decile 8 | 0.000528824 |
| Decile 7 | 0.000508867 |
| Decile 6 | 0.000492807 |
| Median | 0.000478921 |
| Decile 4 | 0.000465927 |
| Decile 3 | 0.000453034 |
| Decile 2 | 0.000438402 |
| Decile 1 | 0.000419807 |
| Minimum | 0 |
|

|
- Mean = 0.000485566
- Std.dev = 5.72605e-05
- 18 items below graph minimum of 0.000280112
- 227 items above graph maximum of 0.000699198
|
Instance 3 : First repeat imaging visit (2019+)
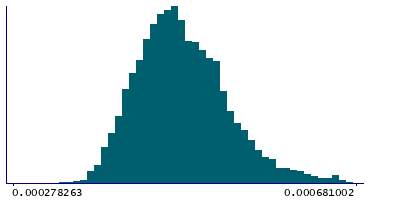
4,758 participants, 4,758 items
| Maximum | 0.000861537 |
| Decile 9 | 0.000546778 |
| Decile 8 | 0.000518402 |
| Decile 7 | 0.000501428 |
| Decile 6 | 0.000485309 |
| Median | 0.00047105 |
| Decile 4 | 0.000458423 |
| Decile 3 | 0.000445839 |
| Decile 2 | 0.000431461 |
| Decile 1 | 0.000412504 |
| Minimum | 0 |
|

|
- Mean = 0.000477015
- Std.dev = 5.48139e-05
- 1 item below graph minimum of 0.00027823
- 9 items above graph maximum of 0.000681052
|
Notes
Weighted-mean L3 in tract forceps major (from dMRI data)
0 Related Data-Fields
There are no related data-fields
2 Applications
| Application ID | Title |
|---|
| 17689 | Genetic, environmental and lifestyle predictors of brain/cognitive-related outcomes. |
| 22783 | The joint analysis of imaging data and genetic data for early tumor detection, prevention, diagnosis and treatment |


