Data
83,909 items of data are available, covering 79,382 participants.
Defined-instances run from 2 to 3, labelled using Instancing
2.
Units of measurement are AU.
| Maximum | 0.00109359 |
| Decile 9 | 0.000547123 |
| Decile 8 | 0.000528455 |
| Decile 7 | 0.00051597 |
| Decile 6 | 0.0005058 |
| Median | 0.000496749 |
| Decile 4 | 0.00048782 |
| Decile 3 | 0.000478293 |
| Decile 2 | 0.000467648 |
| Decile 1 | 0.000453015 |
| Minimum | 0 |
|
|
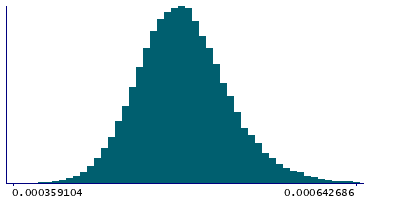
- Mean = 0.000499003
- Std.dev = 3.99299e-05
- 32 items below graph minimum of 0.000358906
- 240 items above graph maximum of 0.000641232
|
2 Instances
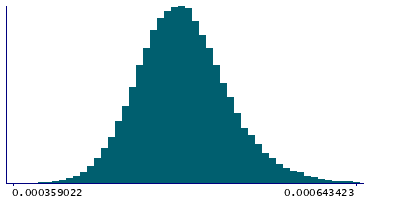
Instance 2 : Imaging visit (2014+)
79,151 participants, 79,151 items
| Maximum | 0.00109359 |
| Decile 9 | 0.000547383 |
| Decile 8 | 0.000528578 |
| Decile 7 | 0.000516082 |
| Decile 6 | 0.000505913 |
| Median | 0.000496831 |
| Decile 4 | 0.000487899 |
| Decile 3 | 0.000478377 |
| Decile 2 | 0.000467683 |
| Decile 1 | 0.000453117 |
| Minimum | 0 |
|
|
- Mean = 0.000499143
- Std.dev = 4.00116e-05
- 29 items below graph minimum of 0.000358852
- 233 items above graph maximum of 0.000641648
|
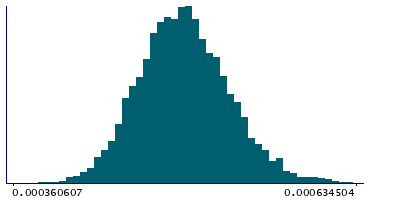
Instance 3 : First repeat imaging visit (2019+)
4,758 participants, 4,758 items
| Maximum | 0.000792317 |
| Decile 9 | 0.000543221 |
| Decile 8 | 0.000526116 |
| Decile 7 | 0.000514168 |
| Decile 6 | 0.000504072 |
| Median | 0.000495337 |
| Decile 4 | 0.000486643 |
| Decile 3 | 0.000477001 |
| Decile 2 | 0.000466602 |
| Decile 1 | 0.000451901 |
| Minimum | 0 |
|
|
- Mean = 0.000496669
- Std.dev = 3.84701e-05
- 3 items below graph minimum of 0.000360581
- 4 items above graph maximum of 0.000634541
|
Notes
Weighted-mean L3 in tract right acoustic radiation (from dMRI data)
0 Related Data-Fields
There are no related data-fields
2 Applications
| Application ID | Title |
|---|
| 17689 | Genetic, environmental and lifestyle predictors of brain/cognitive-related outcomes. |
| 22783 | The joint analysis of imaging data and genetic data for early tumor detection, prevention, diagnosis and treatment |

