Data
83,909 items of data are available, covering 79,382 participants.
Defined-instances run from 2 to 3, labelled using Instancing
2.
Units of measurement are AU.
| Maximum | 0.000870223 |
| Decile 9 | 0.00065029 |
| Decile 8 | 0.000636241 |
| Decile 7 | 0.00062661 |
| Decile 6 | 0.000618712 |
| Median | 0.000611453 |
| Decile 4 | 0.000604227 |
| Decile 3 | 0.000596769 |
| Decile 2 | 0.000588188 |
| Decile 1 | 0.000576301 |
| Minimum | 0 |
|
|
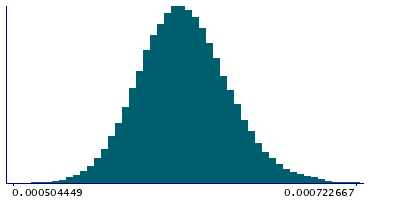
- Mean = 0.000612537
- Std.dev = 3.1881e-05
- 34 items below graph minimum of 0.000502311
- 139 items above graph maximum of 0.00072428
|
2 Instances
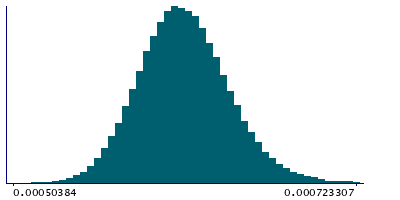
Instance 2 : Imaging visit (2014+)
79,151 participants, 79,151 items
| Maximum | 0.000870223 |
| Decile 9 | 0.000650405 |
| Decile 8 | 0.000636401 |
| Decile 7 | 0.00062672 |
| Decile 6 | 0.000618814 |
| Median | 0.000611534 |
| Decile 4 | 0.000604328 |
| Decile 3 | 0.000596859 |
| Decile 2 | 0.000588242 |
| Decile 1 | 0.000576332 |
| Minimum | 0 |
|
|
- Mean = 0.000612649
- Std.dev = 3.1845e-05
- 31 items below graph minimum of 0.000502259
- 135 items above graph maximum of 0.000724478
|
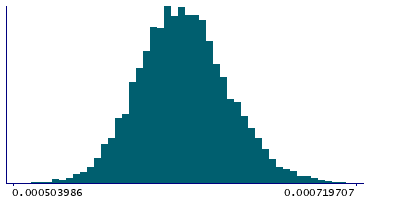
Instance 3 : First repeat imaging visit (2019+)
4,758 participants, 4,758 items
| Maximum | 0.000789594 |
| Decile 9 | 0.000647841 |
| Decile 8 | 0.000634102 |
| Decile 7 | 0.000624833 |
| Decile 6 | 0.000617322 |
| Median | 0.000609909 |
| Decile 4 | 0.000602719 |
| Decile 3 | 0.00059535 |
| Decile 2 | 0.000587338 |
| Decile 1 | 0.000575873 |
| Minimum | 0 |
|
|
- Mean = 0.000610677
- Std.dev = 3.24189e-05
- 3 items below graph minimum of 0.000503905
- 5 items above graph maximum of 0.000719809
|
Notes
Weighted-mean L2 in tract left corticospinal tract (from dMRI data)
0 Related Data-Fields
There are no related data-fields
2 Applications
| Application ID | Title |
|---|
| 17689 | Genetic, environmental and lifestyle predictors of brain/cognitive-related outcomes. |
| 22783 | The joint analysis of imaging data and genetic data for early tumor detection, prevention, diagnosis and treatment |

