Data
83,909 items of data are available, covering 79,382 participants.
Defined-instances run from 2 to 3, labelled using Instancing
2.
Units of measurement are AU.
| Maximum | 0.00197392 |
| Decile 9 | 0.000926117 |
| Decile 8 | 0.000882545 |
| Decile 7 | 0.000856731 |
| Decile 6 | 0.000837711 |
| Median | 0.000822112 |
| Decile 4 | 0.000807736 |
| Decile 3 | 0.000793454 |
| Decile 2 | 0.000777797 |
| Decile 1 | 0.00075705 |
| Minimum | 0 |
|

|
- Mean = 0.000834726
- Std.dev = 7.67168e-05
- 23 items below graph minimum of 0.000587984
- 795 items above graph maximum of 0.00109518
|
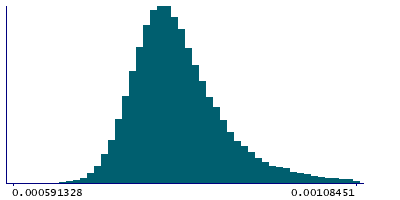
2 Instances
Instance 2 : Imaging visit (2014+)
79,151 participants, 79,151 items
| Maximum | 0.00197392 |
| Decile 9 | 0.00092723 |
| Decile 8 | 0.00088344 |
| Decile 7 | 0.000857505 |
| Decile 6 | 0.000838422 |
| Median | 0.000822642 |
| Decile 4 | 0.000808241 |
| Decile 3 | 0.000793907 |
| Decile 2 | 0.000778226 |
| Decile 1 | 0.000757383 |
| Minimum | 0 |
|
|
- Mean = 0.00083547
- Std.dev = 7.70182e-05
- 20 items below graph minimum of 0.000587537
- 756 items above graph maximum of 0.00109708
|
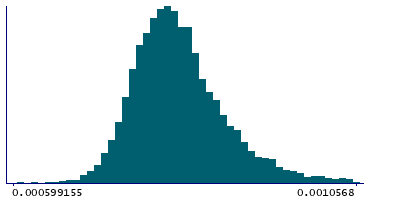
Instance 3 : First repeat imaging visit (2019+)
4,758 participants, 4,758 items
| Maximum | 0.00147446 |
| Decile 9 | 0.000904252 |
| Decile 8 | 0.000867368 |
| Decile 7 | 0.00084376 |
| Decile 6 | 0.000827509 |
| Median | 0.00081324 |
| Decile 4 | 0.000799805 |
| Decile 3 | 0.000786318 |
| Decile 2 | 0.000770963 |
| Decile 1 | 0.000751733 |
| Minimum | 0 |
|
|
- Mean = 0.000822345
- Std.dev = 7.0373e-05
- 3 items below graph minimum of 0.000599214
- 36 items above graph maximum of 0.00105677
|
Notes
Weighted-mean L2 in tract right parahippocampal part of cingulum (from dMRI data)
0 Related Data-Fields
There are no related data-fields
2 Applications
| Application ID | Title |
|---|
| 17689 | Genetic, environmental and lifestyle predictors of brain/cognitive-related outcomes. |
| 22783 | The joint analysis of imaging data and genetic data for early tumor detection, prevention, diagnosis and treatment |

