Data
83,909 items of data are available, covering 79,382 participants.
Defined-instances run from 2 to 3, labelled using Instancing
2.
Units of measurement are AU.
| Maximum | 0.000995199 |
| Decile 9 | 0.000647614 |
| Decile 8 | 0.000630093 |
| Decile 7 | 0.000617571 |
| Decile 6 | 0.000607136 |
| Median | 0.000597531 |
| Decile 4 | 0.00058821 |
| Decile 3 | 0.00057847 |
| Decile 2 | 0.000567104 |
| Decile 1 | 0.000551552 |
| Minimum | 0 |
|

|
- Mean = 0.000598688
- Std.dev = 3.91622e-05
- 28 items below graph minimum of 0.000455489
- 41 items above graph maximum of 0.000743677
|
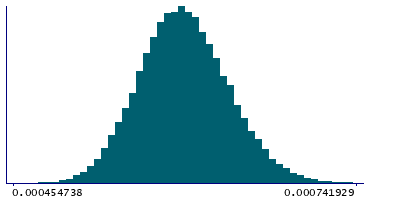
2 Instances
Instance 2 : Imaging visit (2014+)
79,151 participants, 79,151 items
| Maximum | 0.000995199 |
| Decile 9 | 0.000647773 |
| Decile 8 | 0.000630302 |
| Decile 7 | 0.000617749 |
| Decile 6 | 0.000607273 |
| Median | 0.000597636 |
| Decile 4 | 0.000588294 |
| Decile 3 | 0.000578545 |
| Decile 2 | 0.000567161 |
| Decile 1 | 0.000551575 |
| Minimum | 0 |
|
|
- Mean = 0.000598822
- Std.dev = 3.91775e-05
- 25 items below graph minimum of 0.000455377
- 39 items above graph maximum of 0.000743971
|
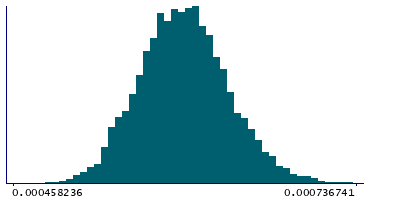
Instance 3 : First repeat imaging visit (2019+)
4,758 participants, 4,758 items
| Maximum | 0.000766428 |
| Decile 9 | 0.000643938 |
| Decile 8 | 0.000626 |
| Decile 7 | 0.00061451 |
| Decile 6 | 0.000604965 |
| Median | 0.00059599 |
| Decile 4 | 0.000586724 |
| Decile 3 | 0.000577548 |
| Decile 2 | 0.000566421 |
| Decile 1 | 0.000551079 |
| Minimum | 0 |
|
|
- Mean = 0.000596455
- Std.dev = 3.88373e-05
- 3 items below graph minimum of 0.00045822
- 1 item above graph maximum of 0.000736797
|
Notes
Weighted-mean L2 in tract left cingulate gyrus part of cingulum (from dMRI data)
0 Related Data-Fields
There are no related data-fields
2 Applications
| Application ID | Title |
|---|
| 17689 | Genetic, environmental and lifestyle predictors of brain/cognitive-related outcomes. |
| 22783 | The joint analysis of imaging data and genetic data for early tumor detection, prevention, diagnosis and treatment |

