Data
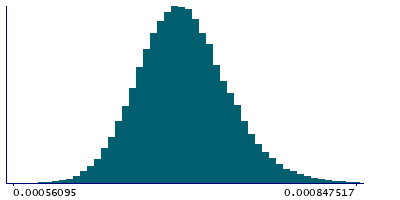
83,909 items of data are available, covering 79,382 participants.
Defined-instances run from 2 to 3, labelled using Instancing
2.
Units of measurement are AU.
| Maximum | 0.00142101 |
| Decile 9 | 0.00074989 |
| Decile 8 | 0.0007314 |
| Decile 7 | 0.000718861 |
| Decile 6 | 0.000708443 |
| Median | 0.000699168 |
| Decile 4 | 0.000690021 |
| Decile 3 | 0.000680471 |
| Decile 2 | 0.000669626 |
| Decile 1 | 0.000654621 |
| Minimum | 0 |
|

|
- Mean = 0.00070103
- Std.dev = 4.05012e-05
- 34 items below graph minimum of 0.000559353
- 143 items above graph maximum of 0.000845158
|
2 Instances
Instance 2 : Imaging visit (2014+)
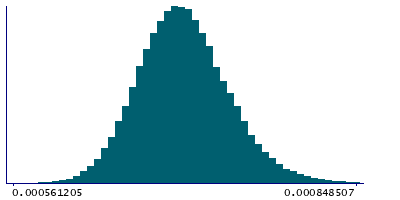
79,151 participants, 79,151 items
| Maximum | 0.00142101 |
| Decile 9 | 0.000750348 |
| Decile 8 | 0.000731784 |
| Decile 7 | 0.000719144 |
| Decile 6 | 0.000708686 |
| Median | 0.000699402 |
| Decile 4 | 0.000690238 |
| Decile 3 | 0.000680659 |
| Decile 2 | 0.000669834 |
| Decile 1 | 0.000654799 |
| Minimum | 0 |
|

|
- Mean = 0.000701298
- Std.dev = 4.05066e-05
- 30 items below graph minimum of 0.00055925
- 137 items above graph maximum of 0.000845897
|
Instance 3 : First repeat imaging visit (2019+)
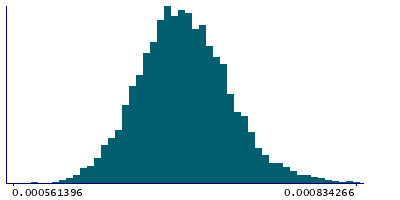
4,758 participants, 4,758 items
| Maximum | 0.000848555 |
| Decile 9 | 0.000743311 |
| Decile 8 | 0.000726202 |
| Decile 7 | 0.000714555 |
| Decile 6 | 0.000704562 |
| Median | 0.000695602 |
| Decile 4 | 0.000686471 |
| Decile 3 | 0.00067763 |
| Decile 2 | 0.000666797 |
| Decile 1 | 0.000652352 |
| Minimum | 0 |
|

|
- Mean = 0.000696573
- Std.dev = 4.01496e-05
- 4 items below graph minimum of 0.000561393
- 2 items above graph maximum of 0.00083427
|
Notes
Weighted-mean L2 in tract left acoustic radiation (from dMRI data)
0 Related Data-Fields
There are no related data-fields
2 Applications
| Application ID | Title |
|---|
| 17689 | Genetic, environmental and lifestyle predictors of brain/cognitive-related outcomes. |
| 22783 | The joint analysis of imaging data and genetic data for early tumor detection, prevention, diagnosis and treatment |


