Data
83,909 items of data are available, covering 79,382 participants.
Defined-instances run from 2 to 3, labelled using Instancing
2.
Units of measurement are AU.
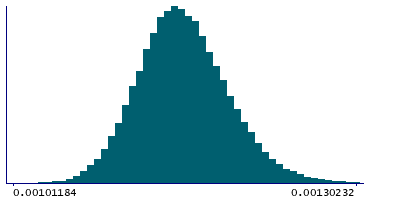
| Maximum | 0.00241736 |
| Decile 9 | 0.00120628 |
| Decile 8 | 0.00118738 |
| Decile 7 | 0.00117432 |
| Decile 6 | 0.00116381 |
| Median | 0.00115419 |
| Decile 4 | 0.00114492 |
| Decile 3 | 0.00113536 |
| Decile 2 | 0.00112446 |
| Decile 1 | 0.00110931 |
| Minimum | 0 |
|
|
- Mean = 0.00115651
- Std.dev = 4.2359e-05
- 16 items below graph minimum of 0.00101235
- 163 items above graph maximum of 0.00130325
|
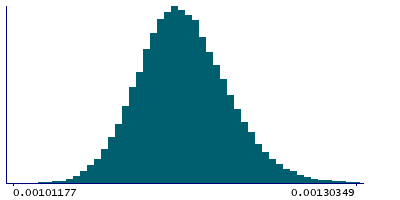
2 Instances
Instance 2 : Imaging visit (2014+)
79,151 participants, 79,151 items
| Maximum | 0.00241736 |
| Decile 9 | 0.00120694 |
| Decile 8 | 0.00118801 |
| Decile 7 | 0.00117497 |
| Decile 6 | 0.00116441 |
| Median | 0.0011548 |
| Decile 4 | 0.00114546 |
| Decile 3 | 0.00113586 |
| Decile 2 | 0.00112495 |
| Decile 1 | 0.00110972 |
| Minimum | 0 |
|
|
- Mean = 0.00115705
- Std.dev = 4.24031e-05
- 15 items below graph minimum of 0.00101249
- 155 items above graph maximum of 0.00130417
|
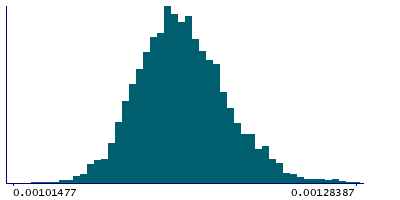
Instance 3 : First repeat imaging visit (2019+)
4,758 participants, 4,758 items
| Maximum | 0.00181058 |
| Decile 9 | 0.0011942 |
| Decile 8 | 0.00117547 |
| Decile 7 | 0.00116393 |
| Decile 6 | 0.00115377 |
| Median | 0.00114517 |
| Decile 4 | 0.00113686 |
| Decile 3 | 0.00112794 |
| Decile 2 | 0.00111788 |
| Decile 1 | 0.00110446 |
| Minimum | 0 |
|
|
- Mean = 0.00114753
- Std.dev = 4.05784e-05
- 1 item below graph minimum of 0.00101472
- 6 items above graph maximum of 0.00128395
|
Notes
Weighted-mean L1 in tract left uncinate fasciculus (from dMRI data)
0 Related Data-Fields
There are no related data-fields
2 Applications
| Application ID | Title |
|---|
| 17689 | Genetic, environmental and lifestyle predictors of brain/cognitive-related outcomes. |
| 22783 | The joint analysis of imaging data and genetic data for early tumor detection, prevention, diagnosis and treatment |

