Data
83,909 items of data are available, covering 79,382 participants.
Defined-instances run from 2 to 3, labelled using Instancing
2.
Units of measurement are AU.
| Maximum | 0.00151798 |
| Decile 9 | 0.00116228 |
| Decile 8 | 0.0011439 |
| Decile 7 | 0.00113209 |
| Decile 6 | 0.00112254 |
| Median | 0.00111417 |
| Decile 4 | 0.00110629 |
| Decile 3 | 0.00109792 |
| Decile 2 | 0.00108846 |
| Decile 1 | 0.00107599 |
| Minimum | 0 |
|
|
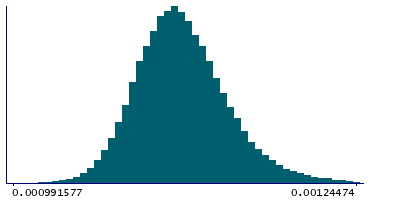
- Mean = 0.00111751
- Std.dev = 3.71063e-05
- 22 items below graph minimum of 0.000989703
- 381 items above graph maximum of 0.00124856
|
2 Instances
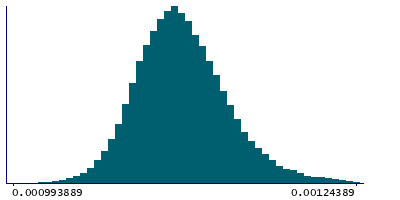
Instance 2 : Imaging visit (2014+)
79,151 participants, 79,151 items
| Maximum | 0.00151798 |
| Decile 9 | 0.00116267 |
| Decile 8 | 0.00114423 |
| Decile 7 | 0.00113239 |
| Decile 6 | 0.00112279 |
| Median | 0.00111441 |
| Decile 4 | 0.0011065 |
| Decile 3 | 0.0010981 |
| Decile 2 | 0.00108859 |
| Decile 1 | 0.00107604 |
| Minimum | 0 |
|
|
- Mean = 0.00111775
- Std.dev = 3.73071e-05
- 22 items below graph minimum of 0.000989411
- 360 items above graph maximum of 0.0012493
|
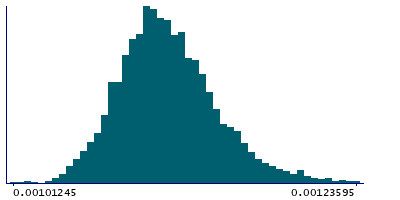
Instance 3 : First repeat imaging visit (2019+)
4,758 participants, 4,758 items
| Maximum | 0.00135987 |
| Decile 9 | 0.00115575 |
| Decile 8 | 0.00113787 |
| Decile 7 | 0.00112718 |
| Decile 6 | 0.00111811 |
| Median | 0.00111029 |
| Decile 4 | 0.0011026 |
| Decile 3 | 0.00109541 |
| Decile 2 | 0.0010868 |
| Decile 1 | 0.0010755 |
| Minimum | 0.00101245 |
|
|
- Mean = 0.00111352
- Std.dev = 3.33376e-05
- 15 items above graph maximum of 0.001236
|
Notes
Weighted-mean L1 in tract left superior longitudinal fasciculus (from dMRI data)
0 Related Data-Fields
There are no related data-fields
2 Applications
| Application ID | Title |
|---|
| 17689 | Genetic, environmental and lifestyle predictors of brain/cognitive-related outcomes. |
| 22783 | The joint analysis of imaging data and genetic data for early tumor detection, prevention, diagnosis and treatment |

