Data
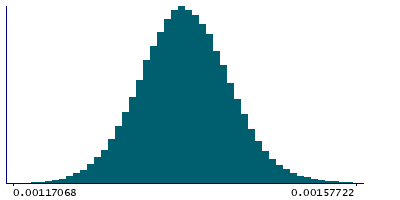
83,909 items of data are available, covering 79,382 participants.
Defined-instances run from 2 to 3, labelled using Instancing
2.
Units of measurement are AU.
| Maximum | 0.00202554 |
| Decile 9 | 0.00143931 |
| Decile 8 | 0.00141538 |
| Decile 7 | 0.00139852 |
| Decile 6 | 0.00138408 |
| Median | 0.0013709 |
| Decile 4 | 0.00135787 |
| Decile 3 | 0.00134386 |
| Decile 2 | 0.00132738 |
| Decile 1 | 0.0013043 |
| Minimum | 0 |
|

|
- Mean = 0.00137155
- Std.dev = 5.62054e-05
- 42 items below graph minimum of 0.0011693
- 109 items above graph maximum of 0.00157431
|
2 Instances
Instance 2 : Imaging visit (2014+)
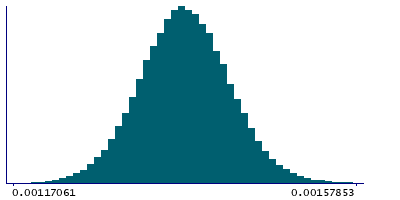
79,151 participants, 79,151 items
| Maximum | 0.00202554 |
| Decile 9 | 0.00143975 |
| Decile 8 | 0.00141581 |
| Decile 7 | 0.00139892 |
| Decile 6 | 0.00138447 |
| Median | 0.00137126 |
| Decile 4 | 0.00135815 |
| Decile 3 | 0.00134406 |
| Decile 2 | 0.00132753 |
| Decile 1 | 0.0013044 |
| Minimum | 0 |
|

|
- Mean = 0.00137185
- Std.dev = 5.62293e-05
- 37 items below graph minimum of 0.00116904
- 99 items above graph maximum of 0.00157511
|
Instance 3 : First repeat imaging visit (2019+)
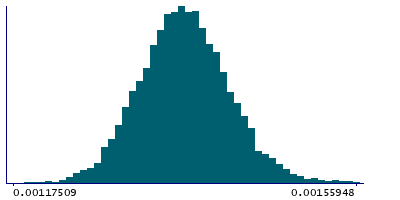
4,758 participants, 4,758 items
| Maximum | 0.00164539 |
| Decile 9 | 0.00143135 |
| Decile 8 | 0.00140788 |
| Decile 7 | 0.00139159 |
| Decile 6 | 0.00137813 |
| Median | 0.00136593 |
| Decile 4 | 0.00135352 |
| Decile 3 | 0.00134045 |
| Decile 2 | 0.00132485 |
| Decile 1 | 0.00130319 |
| Minimum | 0 |
|

|
- Mean = 0.00136665
- Std.dev = 5.55777e-05
- 4 items below graph minimum of 0.00117502
- 9 items above graph maximum of 0.00155952
|
Notes
Weighted-mean L1 in tract right medial lemniscus (from dMRI data)
0 Related Data-Fields
There are no related data-fields
2 Applications
| Application ID | Title |
|---|
| 17689 | Genetic, environmental and lifestyle predictors of brain/cognitive-related outcomes. |
| 22783 | The joint analysis of imaging data and genetic data for early tumor detection, prevention, diagnosis and treatment |


