Data
83,909 items of data are available, covering 79,382 participants.
Defined-instances run from 2 to 3, labelled using Instancing
2.
Units of measurement are AU.
| Maximum | 0.00197884 |
| Decile 9 | 0.00165201 |
| Decile 8 | 0.00162333 |
| Decile 7 | 0.00160341 |
| Decile 6 | 0.00158664 |
| Median | 0.00157157 |
| Decile 4 | 0.00155693 |
| Decile 3 | 0.00154153 |
| Decile 2 | 0.00152422 |
| Decile 1 | 0.00150035 |
| Minimum | 0 |
|

|
- Mean = 0.00157395
- Std.dev = 6.46565e-05
- 33 items below graph minimum of 0.00134869
- 58 items above graph maximum of 0.00180367
|
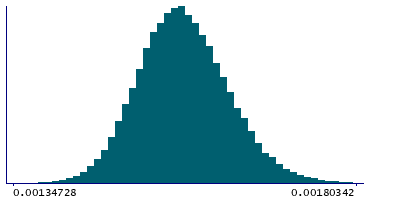
2 Instances
Instance 2 : Imaging visit (2014+)
79,151 participants, 79,151 items
| Maximum | 0.00197884 |
| Decile 9 | 0.00165279 |
| Decile 8 | 0.00162422 |
| Decile 7 | 0.00160424 |
| Decile 6 | 0.00158754 |
| Median | 0.00157248 |
| Decile 4 | 0.00155785 |
| Decile 3 | 0.00154234 |
| Decile 2 | 0.00152506 |
| Decile 1 | 0.00150094 |
| Minimum | 0 |
|
|
- Mean = 0.00157479
- Std.dev = 6.46909e-05
- 29 items below graph minimum of 0.00134909
- 54 items above graph maximum of 0.00180464
|
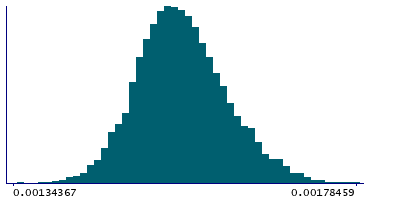
Instance 3 : First repeat imaging visit (2019+)
4,758 participants, 4,758 items
| Maximum | 0.0018063 |
| Decile 9 | 0.0016377 |
| Decile 8 | 0.00160704 |
| Decile 7 | 0.00158715 |
| Decile 6 | 0.00157105 |
| Median | 0.00155685 |
| Decile 4 | 0.00154268 |
| Decile 3 | 0.00152879 |
| Decile 2 | 0.00151248 |
| Decile 1 | 0.00149065 |
| Minimum | 0 |
|
|
- Mean = 0.00155998
- Std.dev = 6.24476e-05
- 4 items below graph minimum of 0.0013436
- 2 items above graph maximum of 0.00178475
|
Notes
Weighted-mean L1 in tract forceps major (from dMRI data)
0 Related Data-Fields
There are no related data-fields
2 Applications
| Application ID | Title |
|---|
| 17689 | Genetic, environmental and lifestyle predictors of brain/cognitive-related outcomes. |
| 22783 | The joint analysis of imaging data and genetic data for early tumor detection, prevention, diagnosis and treatment |

